ES Short Term Trading 10-18-10
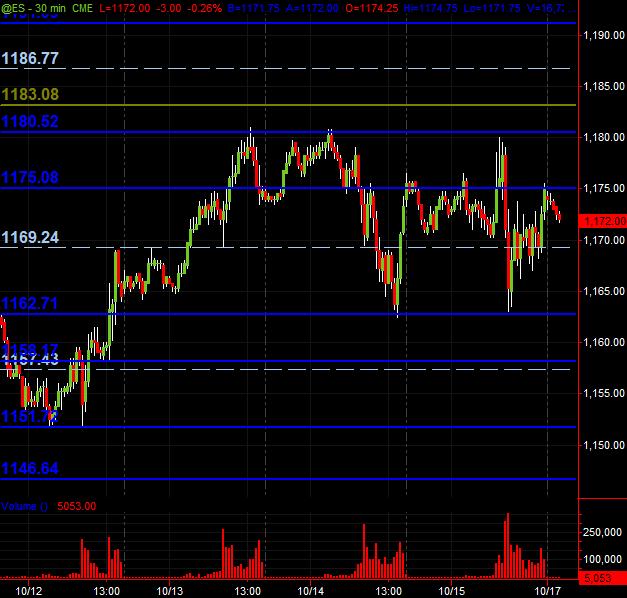
Thought I'd launch the daily ES thread. And, as usual, it's my "map" of what I'm looking at for the day for both ES and equity trading. This is a 30-minute chart showing Price Action Support Resistance lines in solid Blue. Also, in dashed light Blue are the Wkly Pivot levels. Any price line is a "zone" give or take a few ticks. Any confluence of other techniques/strategeries/methods that coincide with a price zone of what I see is more significant.
Don't forget Bruce's MP approach (and others that follow that as well as offering additional analysis). And, per Bruce, don't forget to keep an eye out on AIR ... TRIPS ... and the running out of O/N trading hi/low for fades (as well as prior trading day high/lows) ... all about FADING moves and looking for a target where the market should go, and then finding a decent entry area.
Don't forget Bruce's MP approach (and others that follow that as well as offering additional analysis). And, per Bruce, don't forget to keep an eye out on AIR ... TRIPS ... and the running out of O/N trading hi/low for fades (as well as prior trading day high/lows) ... all about FADING moves and looking for a target where the market should go, and then finding a decent entry area.
Click image for original size
Emini Day Trading /
Daily Notes /
Forecast /
Economic Events /
Search /
Terms and Conditions /
Disclaimer /
Books /
Online Books /
Site Map /
Contact /
Privacy Policy /
Links /
About /
Day Trading Forum /
Investment Calculators /
Pivot Point Calculator /
Market Profile Generator /
Fibonacci Calculator /
Mailing List /
Advertise Here /
Articles /
Financial Terms /
Brokers /
Software /
Holidays /
Stock Split Calendar /
Mortgage Calculator /
Donate
Copyright © 2004-2023, MyPivots. All rights reserved.
Copyright © 2004-2023, MyPivots. All rights reserved.