ES short term trading 01/07/11
Some numbers for today's trading.
1266.25 - 1268.00 -1273.50 - 1277.00 - 1281.00
I'm still looking for 1277.00 as first objective and 1281.00 as second objective.
The above will be void if the ES moves below 1266.25.
Below 1266.25 - 1262.50 - 1258.00.
ES trading 1270.00 @ 03:02
Will see, in due time the market will show us the way.
1266.25 - 1268.00 -1273.50 - 1277.00 - 1281.00
I'm still looking for 1277.00 as first objective and 1281.00 as second objective.
The above will be void if the ES moves below 1266.25.
Below 1266.25 - 1262.50 - 1258.00.
ES trading 1270.00 @ 03:02
Will see, in due time the market will show us the way.
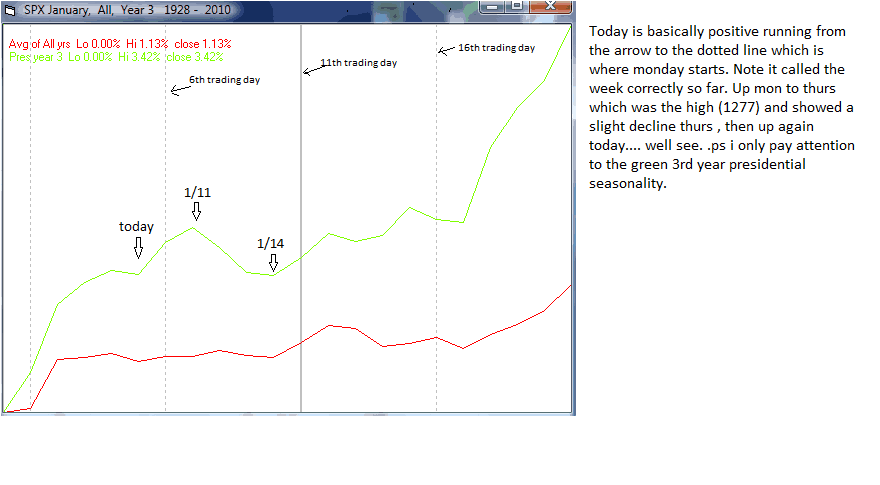
Today is non-farm payrolls day. Here's the thought process i go thru daily to get an initial bearish or bullish bias. First lets look at seasonality again....
Click image for original size
... the seasonality chart from sentimentrader(which i like even more) seems to also hold a bullish bias overall for today.....Click image for original size
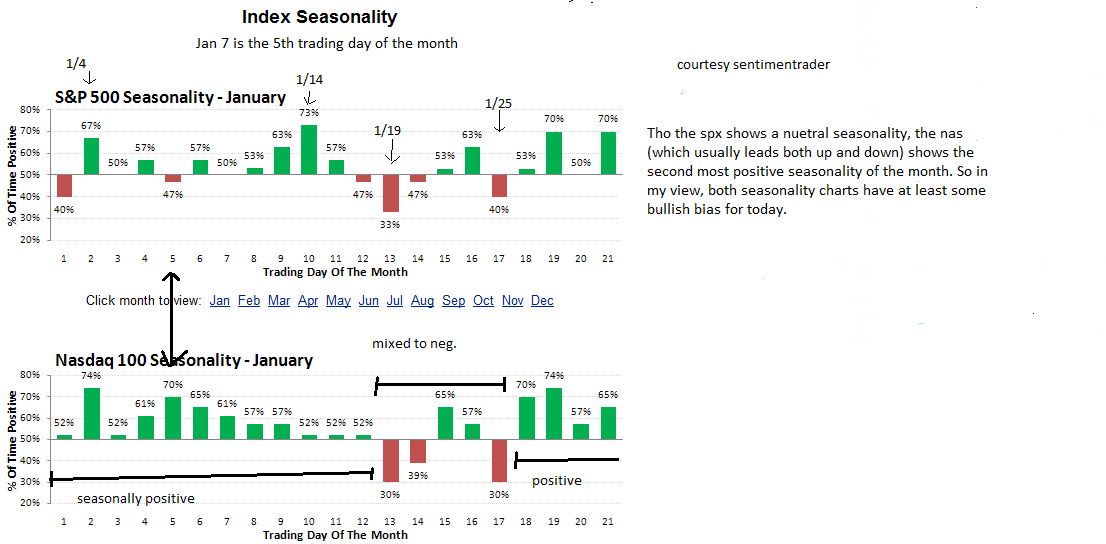
Next ,lets consider statistics. Friday has been up 11 straight times and non farm payroll days have been up 15 out of 22 times since The Mar 09 bear market low. Generally , a lower open at 9:30, gives a trend day up the rest of the day. The opposite is true however , if we should open up! According to Frank Hogelucht, since 1957, whenever we gained 1%in a week but closed lower Thursday like this week, Fridays unemployment day closed higher 25 out of 34 times (70% odds). Just figuring January's unemployment day with the same parameters, it closed up 8 out of 9 times!. So , in summary even if we open lower with a little downdraft early in the session, odds seem very good ,statistically, and historically, for an up close.
Be aware that these are only seasonal, statisical,and historical tendencies and occasionally the market surprises everyone! Anything can ,and sometimes does happen! But do your homework and prepare well each and every trading day and week and your trading will no doubt improve, but be prepared to adjust if the market begins to behave the opposite as it should . When that happens, its telling you something. Our job as traders is to listen! Hope this kind of stuff helps some a little bit.
Click image for original size
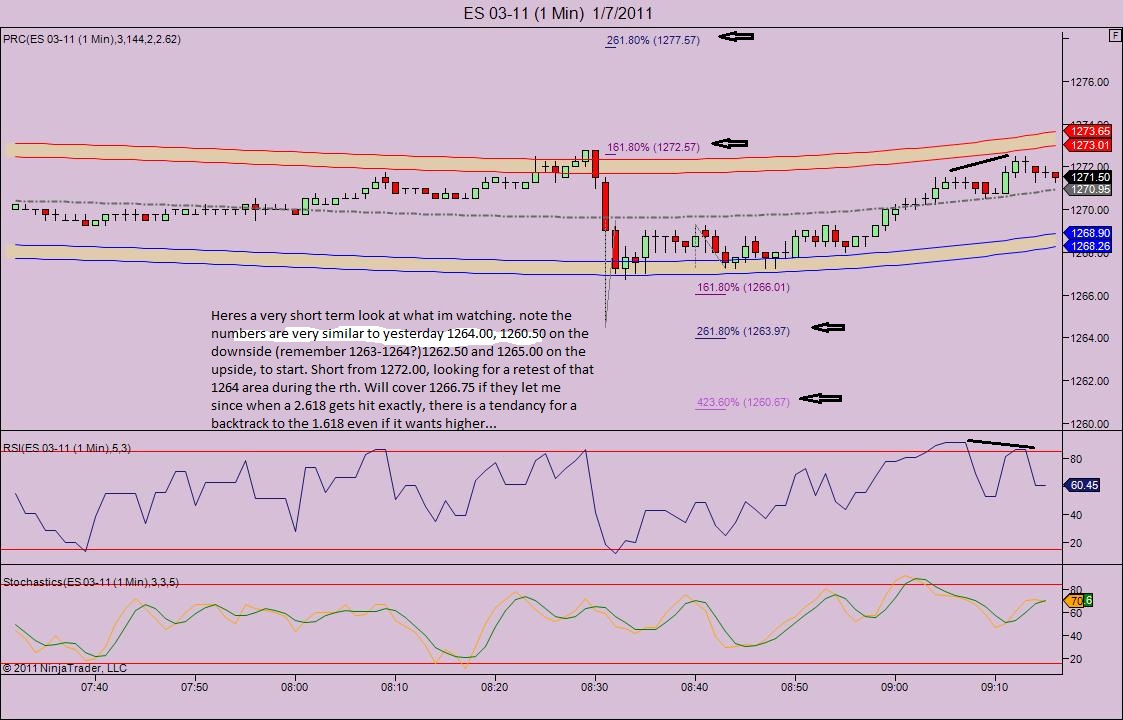
Heres how i play it since i have to leave for a bit.. i will cover one at 1270.00 if they let me and lower my stop from the usual 3 handles to 1274.25 on the runner ,hoping to cover just above the first little bare bones one min initial move (1274.00-1271.50) 2.618 at 1267.50 , so just above at 1268.00 is where i put my exit order.
Wow! gettin lucky? out one at 1270.00,plus 2 handles there, now lowering stop and placing my exit ... see ya in about 1 hour!
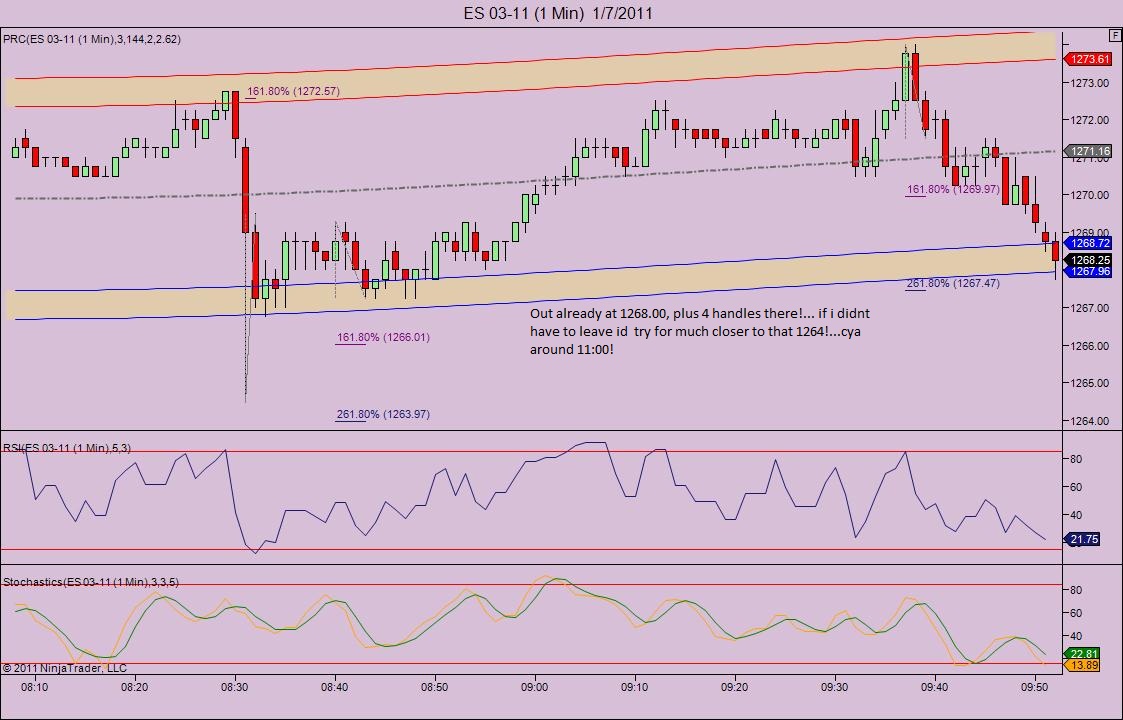
Should have stuck around kool, looks like the 68.50 entry long worked out nice too =)
Yeah, it did,DRob!...Heres where my head is at... so far, i still look for an up close(1270.25 or above)..BUT...there is a danger here. And that is that the 1264.00 projection doesnt provide much bounce and we continue down to that next important zone at 1260! That dam number keeps coming up... i think we saw it on yesterdays charts,too. I was hoping for more postings and analysis, from others here, like Lorn, Bruce, Monkey, and others to see what there thoughts are. I work nights and havent been to bed yet so i dont expect to be around much longer.Anyway , heres a chart showing what i mean....
Click image for original size
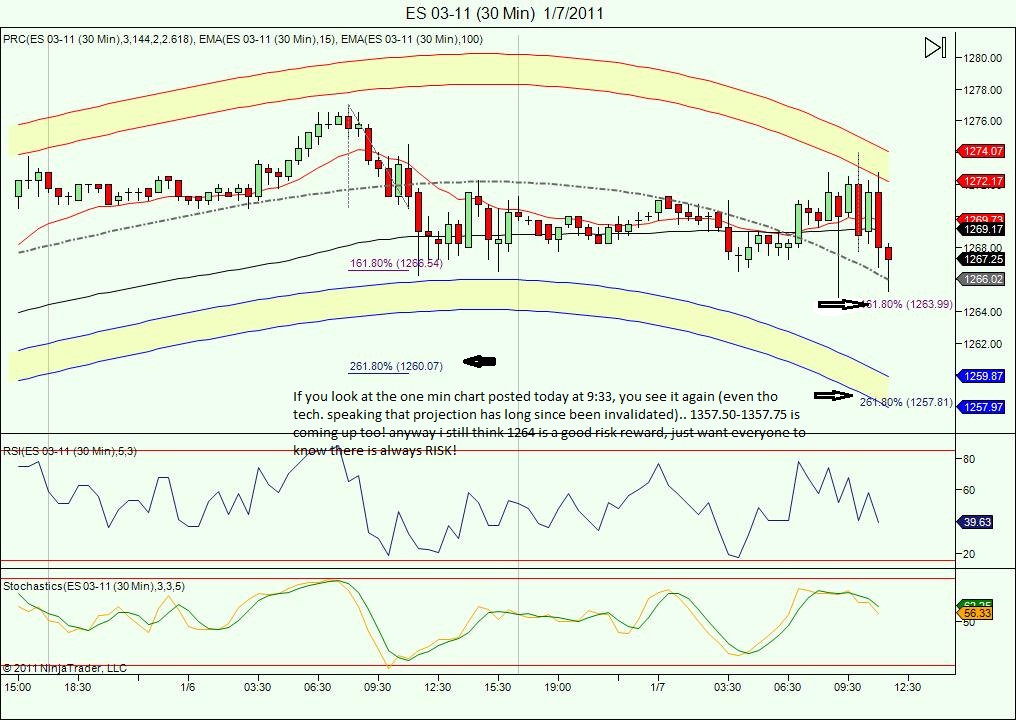
..ORDER TO BUY IS AT 1264.00
No I haven't lorn but will take a look.....mostly I like this as a basic filter for mean reversion and to find a way to hold final runners longer...
I was once told that the big players will look not only at where we close on the daily time frame but also the 30 and 60 minute closes...not sure if it's true.....this concept also can be compared to some of the concepts of the 80% market profile rule which is not a rule that really works...just one of those things that gets passed along the internet
I was once told that the big players will look not only at where we close on the daily time frame but also the 30 and 60 minute closes...not sure if it's true.....this concept also can be compared to some of the concepts of the 80% market profile rule which is not a rule that really works...just one of those things that gets passed along the internet
Emini Day Trading /
Daily Notes /
Forecast /
Economic Events /
Search /
Terms and Conditions /
Disclaimer /
Books /
Online Books /
Site Map /
Contact /
Privacy Policy /
Links /
About /
Day Trading Forum /
Investment Calculators /
Pivot Point Calculator /
Market Profile Generator /
Fibonacci Calculator /
Mailing List /
Advertise Here /
Articles /
Financial Terms /
Brokers /
Software /
Holidays /
Stock Split Calendar /
Mortgage Calculator /
Donate
Copyright © 2004-2023, MyPivots. All rights reserved.
Copyright © 2004-2023, MyPivots. All rights reserved.