ES trading 4-5-11
I just updated my video from Friday which hopefully has better sound...please let me know if you can actually hear this one
Hello guys. I am in and out these days, so hard participate in discussion. My offer to connect on Skype still stands.
I track high volumes that I see of bids and asks. SOmetimes it comes at "levels of interest", sometimes not. When I see high volume, I assume that a party (I call Mr. BigWig) entered the market. IF it makes sense to me, I join the party.
After the big order appears, Mr BigWIg often makes progress in the direction entered. Sometimes Mr. Big Wig fails to move market in the desired direction. The following exit often triggers a violent move, especially in thin market - not my favorite time to trade.
As Lorn mentioned before, sometimes Mr. BigWig (and others who join the effort) tries move the market, say to sell, but find a responsive buyer. That often happends in the area of previous strong move origins - those single prints at the beginning of the strong move. I imagine that there are "residual orders" from that big move. These orders can just sit there waiting for the price to come to them. If the responsive buyers (they just absorb the bid and do not hit the ask) still has enough contracts and Mr BigWig and Co cannot push through, he covers fast and fusrious.
Bruce, this is no different than you trading your "significant levels". Sometimes market turns there, sometimes not. When you trying to fade a trend you never know the outcome of your effort - that is why you have stops.
I post when I see Mr Big Wig's footprint - large number. Best time to enter a "fade" trade against the trend is on retest of that level with lower volume, sometimes multiple retests. That oppportunity does not always occur. Sometimes it is "start and drive", the responsive order is larger than Mr BigWIg's effort. There is no way of knowing that - I can only watch Mr BigWig's effort and see if he is #winning (lol) or failing. Same as trading your levels, Bruce.
When I see accumilation of contracts or a single large order pops up I see it in development, whereas my posts are static. OFten observing the action helps, as I see the waves of effort. As my charst are "point and figure" the post does not show the accumulative action to fill those prints.
Frankly, sometimes watching bid-ask action helps, sometimes not. IT is same with watching time and sales when one takes a trade.
Sorry for the long post. Not sure if I answered your questions. If you have more, I would be happy to answer. IT is tough to use this Forum as a discussion. I repeat my offer to connect on Skype.

Good morning!Seasonality is very positive the first couple days of April,BUT, if you look at data from 1990 on, just the third year of the presidential cycle ,it paints a negative .43% today and negative .63% for tomorrow!.. expect a short term bottom today or tomorrow!...short term projection up is 1328.25 which i'll be selling!
Click image for original size
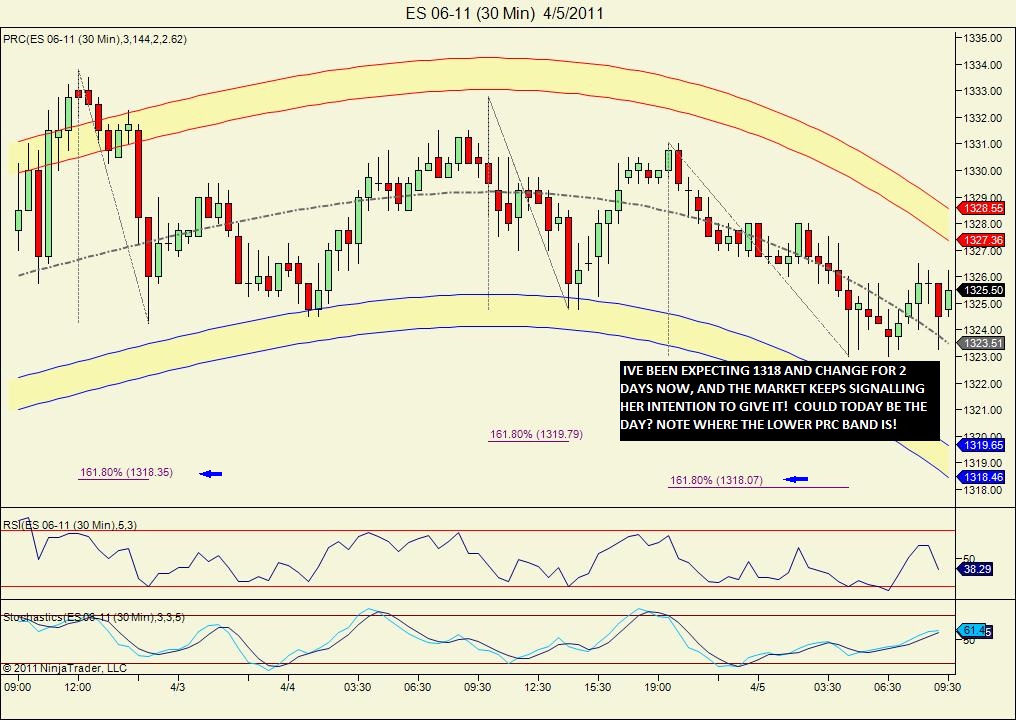
1329.75 is a key price for me..as previous close is there and we spent good volume there in early O/N trade....so a possible fade point
other than that I'm just waiting...may try and agressive short of we trade back below the OR low again to try for 1324.50..
report in 5 minutes and since we didin't run an O/N high or low yesterday we should do it today
other than that I'm just waiting...may try and agressive short of we trade back below the OR low again to try for 1324.50..
report in 5 minutes and since we didin't run an O/N high or low yesterday we should do it today
Click image for original size
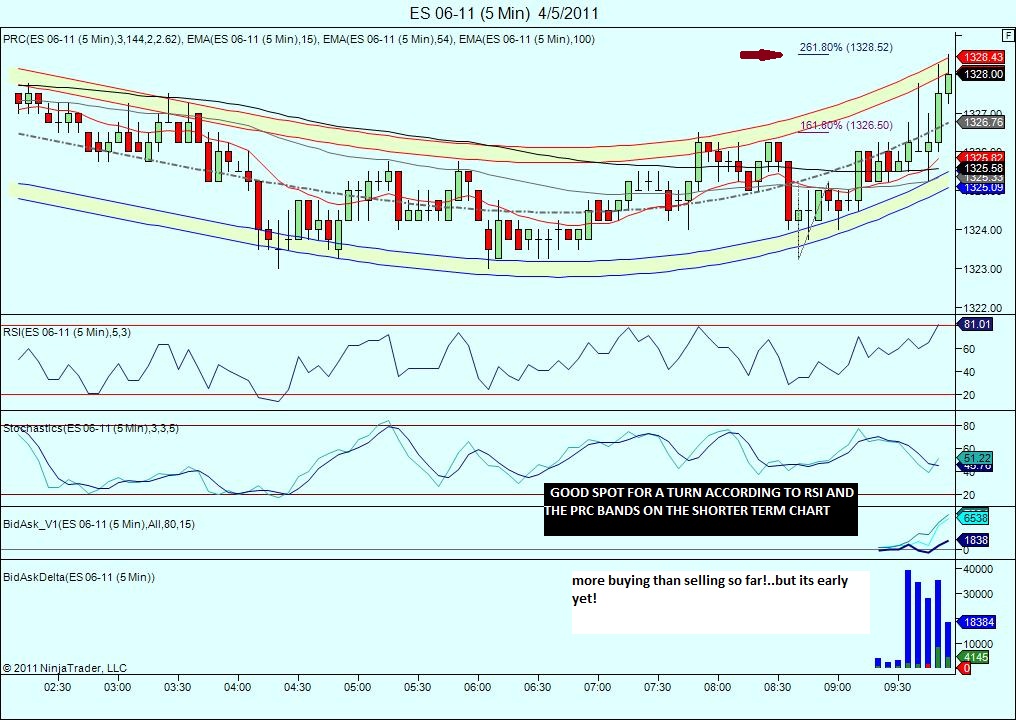
had order in for shorting @ 28.75. missed and pulled the order. May short at settlement for a scalp as that is often rejected. Otherwise I like the 29.75/30 area.
Good morning Folks
Short as posted from 1328.25, covered one at 1326.25,plus 2 handles there ,holding the runner for 1325.25
Nice Kool- see you still on top of the game- I shorted 28 covered 26 based on my 30min chart
Originally posted by palmergreat job!... looking for a very short term projection down of 1324.50, longer term 1318.50!.. daily noted page shows 10 day avg range is 12.5 handles... the high today(hit last nite) is 1331.00-12.5=BINGO!!!
Nice Kool- see you still on top of the game- I shorted 28 covered 26 based on my 30min chart
something to check out looking at end of day where were they all
http://www.cmegroup.com/popup/mdq2.html?code=ESM1&title=June_2011_E_mini_S_P_500_(Dollar)&type=v
http://www.cmegroup.com/popup/mdq2.html?code=ESM1&title=June_2011_E_mini_S_P_500_(Dollar)&type=v
Emini Day Trading /
Daily Notes /
Forecast /
Economic Events /
Search /
Terms and Conditions /
Disclaimer /
Books /
Online Books /
Site Map /
Contact /
Privacy Policy /
Links /
About /
Day Trading Forum /
Investment Calculators /
Pivot Point Calculator /
Market Profile Generator /
Fibonacci Calculator /
Mailing List /
Advertise Here /
Articles /
Financial Terms /
Brokers /
Software /
Holidays /
Stock Split Calendar /
Mortgage Calculator /
Donate
Copyright © 2004-2023, MyPivots. All rights reserved.
Copyright © 2004-2023, MyPivots. All rights reserved.