YMM1, (3, -1), profitable Strategy, 2.618% profitable
Hi,
Basis YMM1 (June e-mni $5 Dow futures):
Trading from unchanged, 12631, and fading the first move, i.e., -1 of (3, -1):
12631 - the Stretch calculation = 12631 - 27 = 12604 (12601 = low at 21:52PDT).
12631 - 27 = 12604, representing the fade, i.e., -1 of (3, -1)
12604 + 27 + 27 + 27 = 12685 (high = 12692 (12694 = high at 07:01PDT)
This completes the 3 of the (3, -1) formula.
Below you'll find a corrolating 2.618% entry level.
Measuring from the 9 May high, 12677 - 2.618 of the 10 May Stretch = 12677 - 70 = 12607. 12601 = low (21:52PDT)
just closed long now, I'm sure it will go to settlement at least. That's me done for the day now, off to play with junior!
you mean you had moved your stop up to the -1.618 level and it got hit ? if so still a good trade down from where the -2.618 was...
was wondering about taking the long when we got back down into the -2.618 / -3.0 area, but i noticed yesterday that when we did this it went all the way down hard....different day of course and hard to expect it to trend like yesterday but from what i have seen these past few days first tests are optimal
great trade btw, what was the level of your second entry if you don't mind, and stop loss level ?
thanks!
Originally posted by Silverharp
got stopped out at 161, very sneaky , reloaded again, yeah below the 300 makes sense, as they are very close together otherwise I just stick with the number
I got back in at 20 and used 12497 as the stop, it was a little risky but DX looked contained so it didnt feel like it was going to be puke day.
The important thing is to be patient with the numbers, look for plenty of divergence, yesterday is an example of a day that would cause a lot of problems if you jumped on a counter trend move. Today for instance I could have taken the 261 buy in the first hour of UK trading but I had no divergence, still got it nearly 2 hours later and wasnt worn out by having a position going nowhere.
The important thing is to be patient with the numbers, look for plenty of divergence, yesterday is an example of a day that would cause a lot of problems if you jumped on a counter trend move. Today for instance I could have taken the 261 buy in the first hour of UK trading but I had no divergence, still got it nearly 2 hours later and wasnt worn out by having a position going nowhere.
thanks...do you look for dvg on the 5min chart or on the shorter term charts...it seems on the 5min chart that there was dvg by the time the -2.618 was hit first, and even more dvg the second and third times
but i get the general idea, fading the 2.618 off settlement, preferably in no strong trending days....
if the market goes from the -2.618 to +2.618 stretch off settlement (like right now) do you ever look to fade the latter or just fade the first one and that's it?
what other trades do you look to take if say you miss the first fade of a 2.618 off the stretch (off settlement)
thanks again for your replies and hopefully...it clarifies things a lot to see trades you took...don't have to be real time, end of day is fine with me
Hi,
Get into position early and quit. I saw a Three Line Strike (Pit Bull Three) candlestick pattern set up developing on the daily chart. 12600 (12609 @ 12:56PDT 11 May; 12602 18:09PDT; and 12603 @ 20:41PDT) was defined as resistance after testing and failing. The five minute chart during the A session makes the patterns easier to recognize. This level was also nearly 2.618% of the Stretch from the 11 May low, 12542 (12609 - 12542 = 67 ... 11 May 2.618% of the Stretch = 70); and it was a 33% bounce into the 11 May 198 point high-low trading range. Daily charts: fractal break down, possible Three Line Strike (Pit Bull Three), ... and on the intra-day 11 May chart, an mild bounce from the low. The bounce from today's low is on a tear.
Get into position early and quit. I saw a Three Line Strike (Pit Bull Three) candlestick pattern set up developing on the daily chart. 12600 (12609 @ 12:56PDT 11 May; 12602 18:09PDT; and 12603 @ 20:41PDT) was defined as resistance after testing and failing. The five minute chart during the A session makes the patterns easier to recognize. This level was also nearly 2.618% of the Stretch from the 11 May low, 12542 (12609 - 12542 = 67 ... 11 May 2.618% of the Stretch = 70); and it was a 33% bounce into the 11 May 198 point high-low trading range. Daily charts: fractal break down, possible Three Line Strike (Pit Bull Three), ... and on the intra-day 11 May chart, an mild bounce from the low. The bounce from today's low is on a tear.
hunter asked you this question before but you probably did not see it
"...would you have taken a long at the start of the A session off the -1 stretch off settlement? ...it was good for 30-35 points before all those failures at 12600 and reversal...did not take it, but was watching it and seemed ok at the time"
"...would you have taken a long at the start of the A session off the -1 stretch off settlement? ...it was good for 30-35 points before all those failures at 12600 and reversal...did not take it, but was watching it and seemed ok at the time"
Hunter,
I'm sure if your strat worked today but it looks close....
From the opening it dropped 65 points.....
I'm doing pivots so the machines bought S1 when momentum went up through it.......@513.
But from the low....YM traveled 183 points (687-504) or approx 3x60.....handgrenade.
Either was a good trade though....
My question is in your experience....does the inverse trade then work?
Such as wait for the 3X move then invert the trade...like go short?
I went short..The pivot is 626 .we'll see.
Just as an FYI.....you can hedge YM trades with DIA options. EQ ratio is about 10 (calls/puts) to 1 YM contract.....The DIA options are very liquid.
Hi Ayn,
Sorry for presuming too much. Tell me if this answers your question.
No, I wouldn't fade the first two pullbacks from the settlement, 12597 to 12572 (highs at 12602 and then 12603), because of the bearish reasons below; as well as the third attempt at testing the 12609 (12:56PDT) last 21 minute high (call it 12600) held and defined resistance at the third attempt. Usually you want to see a tick or a few beyond the respective high, 12609, or the respective low (12 May 12504, 07:05PDT, after the 12506, 06:45PDT). Basis YMM1, the 33% (almost a .382% correction) bounce off the 11 May 198 point range, a weak bounce, and the probabilities of a bearish "Three Line Strike" ("Pit Bull Three" bearish set up... you can probably find it at www.candlesticker.com), and created a tradeable probability that the settlement, 12597, would provide a create selling opportunity. 12626 is the 12 May pivot point. The 11 May settlement (12597) below the pivot point (12626), the settlement at a negative fair value (www.indexarb.com) and the Three Line Strike (Pit Bull Three...www.candlesticker.com ... probably) identified a greater probabiilty that prices would lean towards the sell threshold / sell programs than the buy programs. The early A session resistance patterns, three attempts defined resistance followed by a decline, and the reversal low testing 12506, printed a new low at 12504, which identified no new sellers (and corrolated to a -2.618% decline from the previous settlement),... and subsequently reversed higher on a tear (low to high: +187 points, that so far has nearly matched the 198 point range of 11 May).
Hope that answered your question.
I'm still picking (sticker) burrs and ticks off my dogs after this morning's hike. I need to cut back three miles of trail so I can see the rattlesnakes, and avoid a few thousand burrs and ticks.
Are do ya'll hail from?
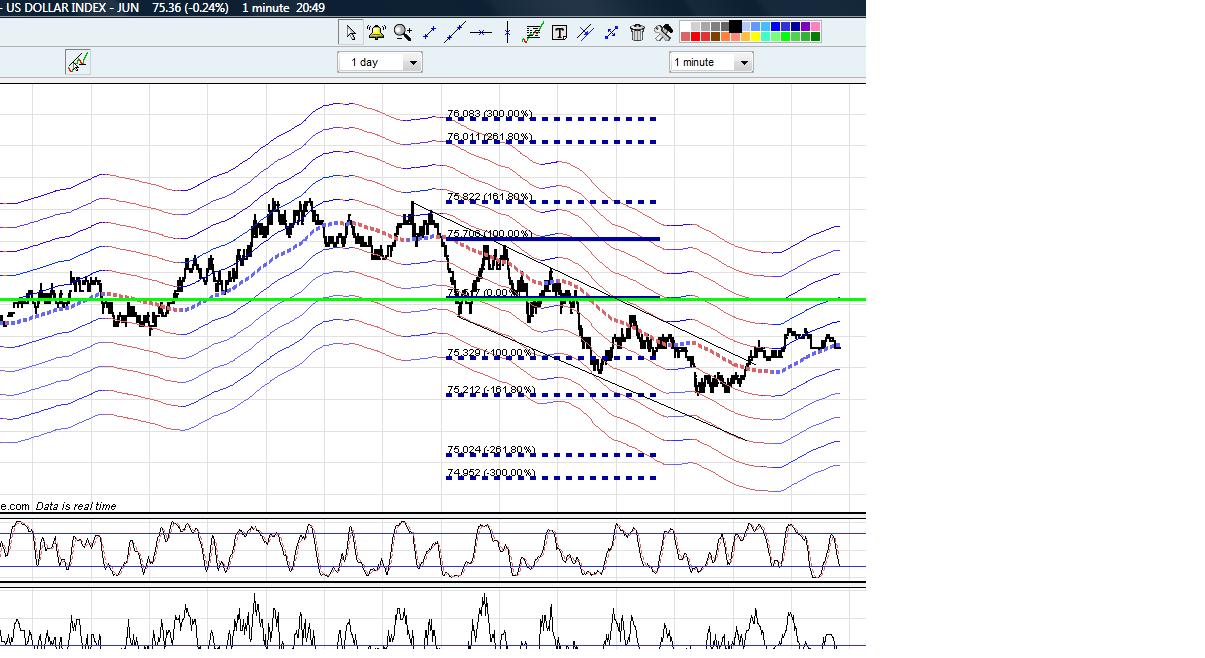
Ayn, it depends on what divergence you are looking for, in the chart I posted, as the momentum indicators were flat I wanted to see the MA on my chart flatten out, first time round it was still pointing down, with the afternoon high (US) the number was X3 and ROC had a nice divergence with the high, the number on its own might have been enough to close a long however combined with the divergence would generate a sell. Was thinking of taking it but not a huge fan of scalping late in the day. There was the weekly pivot at 12636, it was wiggled on the way up so would have been a target from the high, not to be sneezed at if you got short from say 80. If you wanted to be a bit more conservative you would wait for a retest or a setup like Kools lays out well with a rounded top, didnt happen here though
I was keeping an eye on DX today 161 containded the move in both directions, very symmetrical day all round.
Click image for original size
was hoping the es would go to its 1.618 at the open which would have likely pushed ym to its 2.618 stretch...that would have been the ideal scenario for me to get long...
Emini Day Trading /
Daily Notes /
Forecast /
Economic Events /
Search /
Terms and Conditions /
Disclaimer /
Books /
Online Books /
Site Map /
Contact /
Privacy Policy /
Links /
About /
Day Trading Forum /
Investment Calculators /
Pivot Point Calculator /
Market Profile Generator /
Fibonacci Calculator /
Mailing List /
Advertise Here /
Articles /
Financial Terms /
Brokers /
Software /
Holidays /
Stock Split Calendar /
Mortgage Calculator /
Donate
Copyright © 2004-2023, MyPivots. All rights reserved.
Copyright © 2004-2023, MyPivots. All rights reserved.