ES Trading for 7-6-11
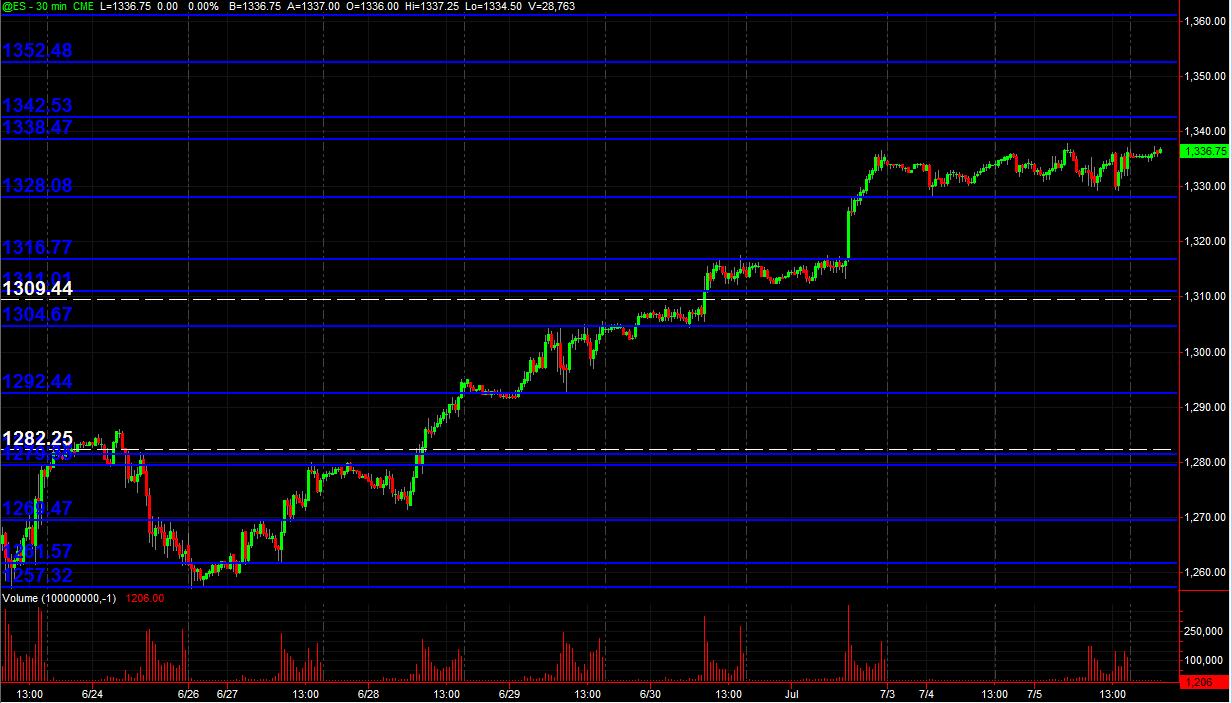
Just posting a 30min chart (all trading hours) with Blue lines as potential significant PASR zones and White dashed lines are Weekly Pivots. It's a map for coming into Wednesday's trading and beyond. After last week's 5 up-trending days, price has been consolidating near the high of that run in the 1328-1338 range of 10 points. Here's the "picture"
Hope some folks find this useful!
Click image for original size
Hope some folks find this useful!
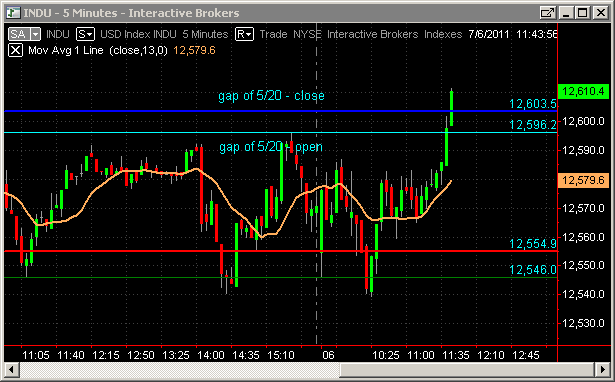
Mission accomplished. Those Morgan Stanley boys are anal about gap close...lol
Click image for original size
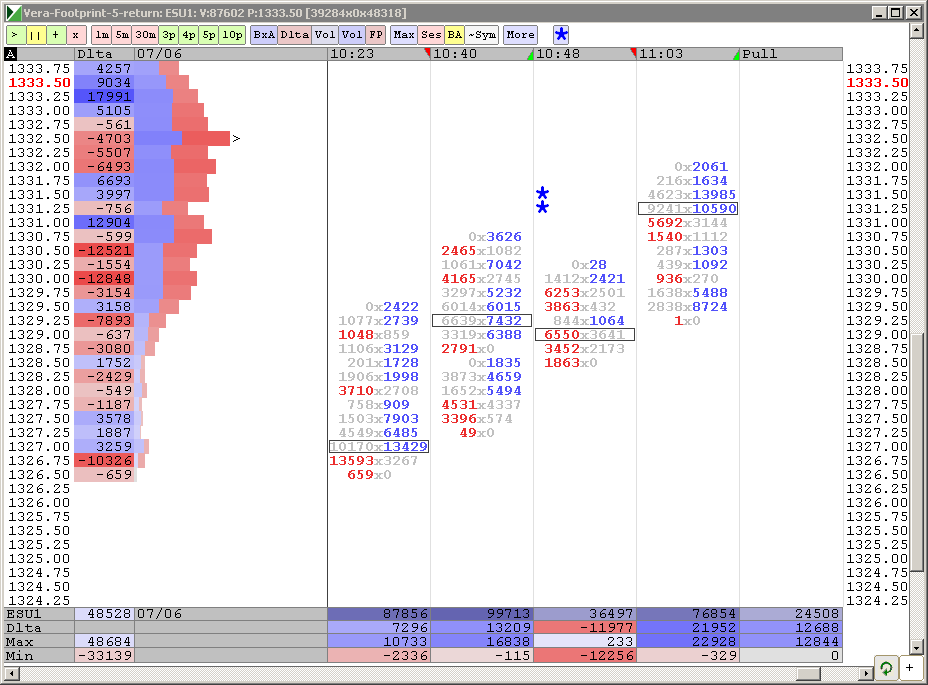
my plan is to start sells at 1335 and above...the outer fringe ( low volume)...will need to see some lower $ticks to show that the distribution of $ticks has the potential to change
BruceM, plese check page 2 of this Forum for my answers to your questions.
thanks Lisa...we do the same things but I watch the one minute...I'll have to add the 10,000 filter for my after market research
do to the consolidation in the first 90 minute we need to be more conservative in our fades....air begins at 33.75 on the downside
Originally posted by BruceM
thanks Lisa...we do the same things but I watch the one minute...I'll have to add the 10,000 filter for my after market research
It may or may not help, as sometimes those big orders are cummulative - several smaller orders. That is why I like P$F charts or "return" charts
"Mission Accomplished" chart...lol. Of course they may stil close today's ES gap at 36.75, but you can see the volume on INDU gap close
Click image for original size
Sorry, I posted the wrong chart - this is the "Mission accomplished" chart. I apologize.
Click image for original size
complete air fill will be at 32.50.....also remember that "air' last week was becoming support quite often....another reason to be quicker and more conservative...While I don't think the concept of air will ever change we need to respect the reversing roles it can play.
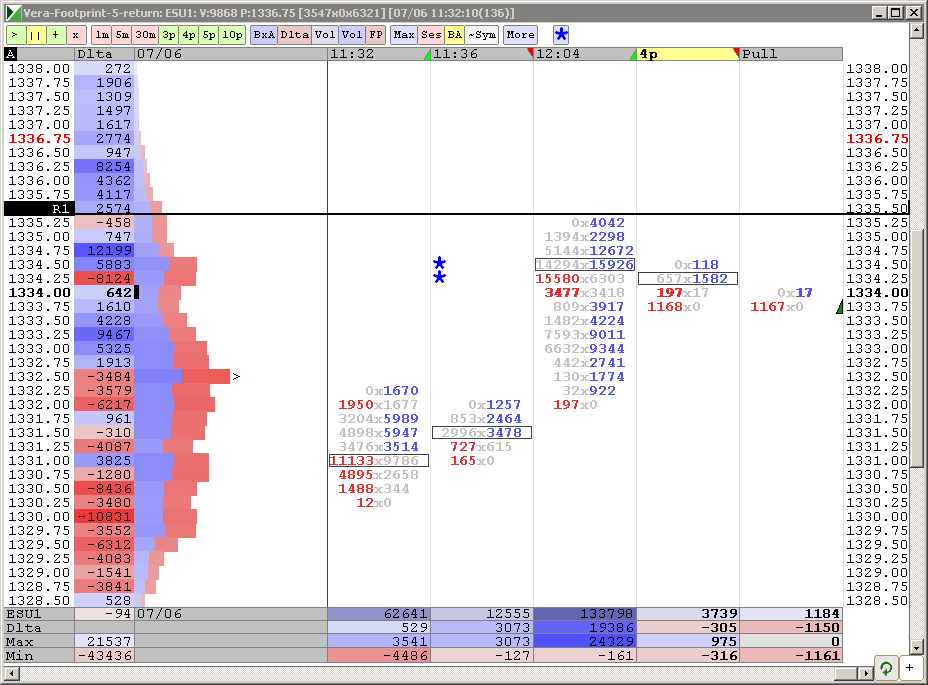
That was a 1400 tick maximum and we have divergence now with volume...a good time for retraces....over lunch in NY
I'm hoping they actually can print an OVB to the upside on the daily chart.....that will be good for us sellers...an up OVB on the daily chart after 5- 6 days up....probably asking for too much
starting new shorts at 36.50...that's 2 sets of single prints now
Lisa, that was simply making my risk equal to reward at that point when price was near 32.75....
Emini Day Trading /
Daily Notes /
Forecast /
Economic Events /
Search /
Terms and Conditions /
Disclaimer /
Books /
Online Books /
Site Map /
Contact /
Privacy Policy /
Links /
About /
Day Trading Forum /
Investment Calculators /
Pivot Point Calculator /
Market Profile Generator /
Fibonacci Calculator /
Mailing List /
Advertise Here /
Articles /
Financial Terms /
Brokers /
Software /
Holidays /
Stock Split Calendar /
Mortgage Calculator /
Donate
Copyright © 2004-2023, MyPivots. All rights reserved.
Copyright © 2004-2023, MyPivots. All rights reserved.