ES Tue 9-6-11
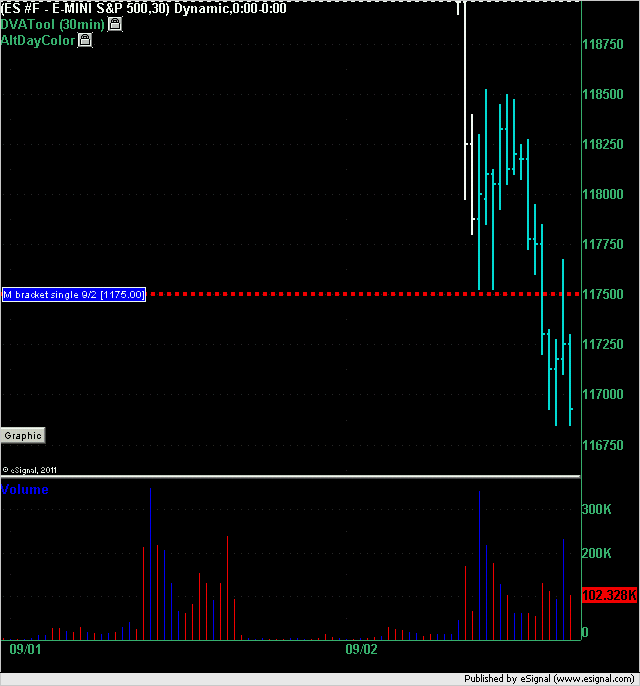
The chart below is from Friday's trading session. The market created a single print in the M bracket at 1175 even and then triggered a short in the last 45 minutes of the day at that price. The market rose to 1176.75 for 1.75 point draw down and then ran up to a best possible profit of 8.25 points at the low of the day 1168.50.
Anybody not trading that single print could be forgiven because it was so late into the day going into the Labor Day holiday weekend.
Anybody not trading that single print could be forgiven because it was so late into the day going into the Labor Day holiday weekend.
Click image for original size
Click image for original size
also watching INDU 11000 - may bounce there
is anyone here today? should I even post?
I am here.....studying this MP concept......which is just volume at price within a calendar window, yes?
Here is the profile of the rally from 1077. Trendline broken, but 38 level had good volume support.....that means buy? Should backtest the underside of the line.
Here is the profile of the rally from 1077. Trendline broken, but 38 level had good volume support.....that means buy? Should backtest the underside of the line.
Click image for original size
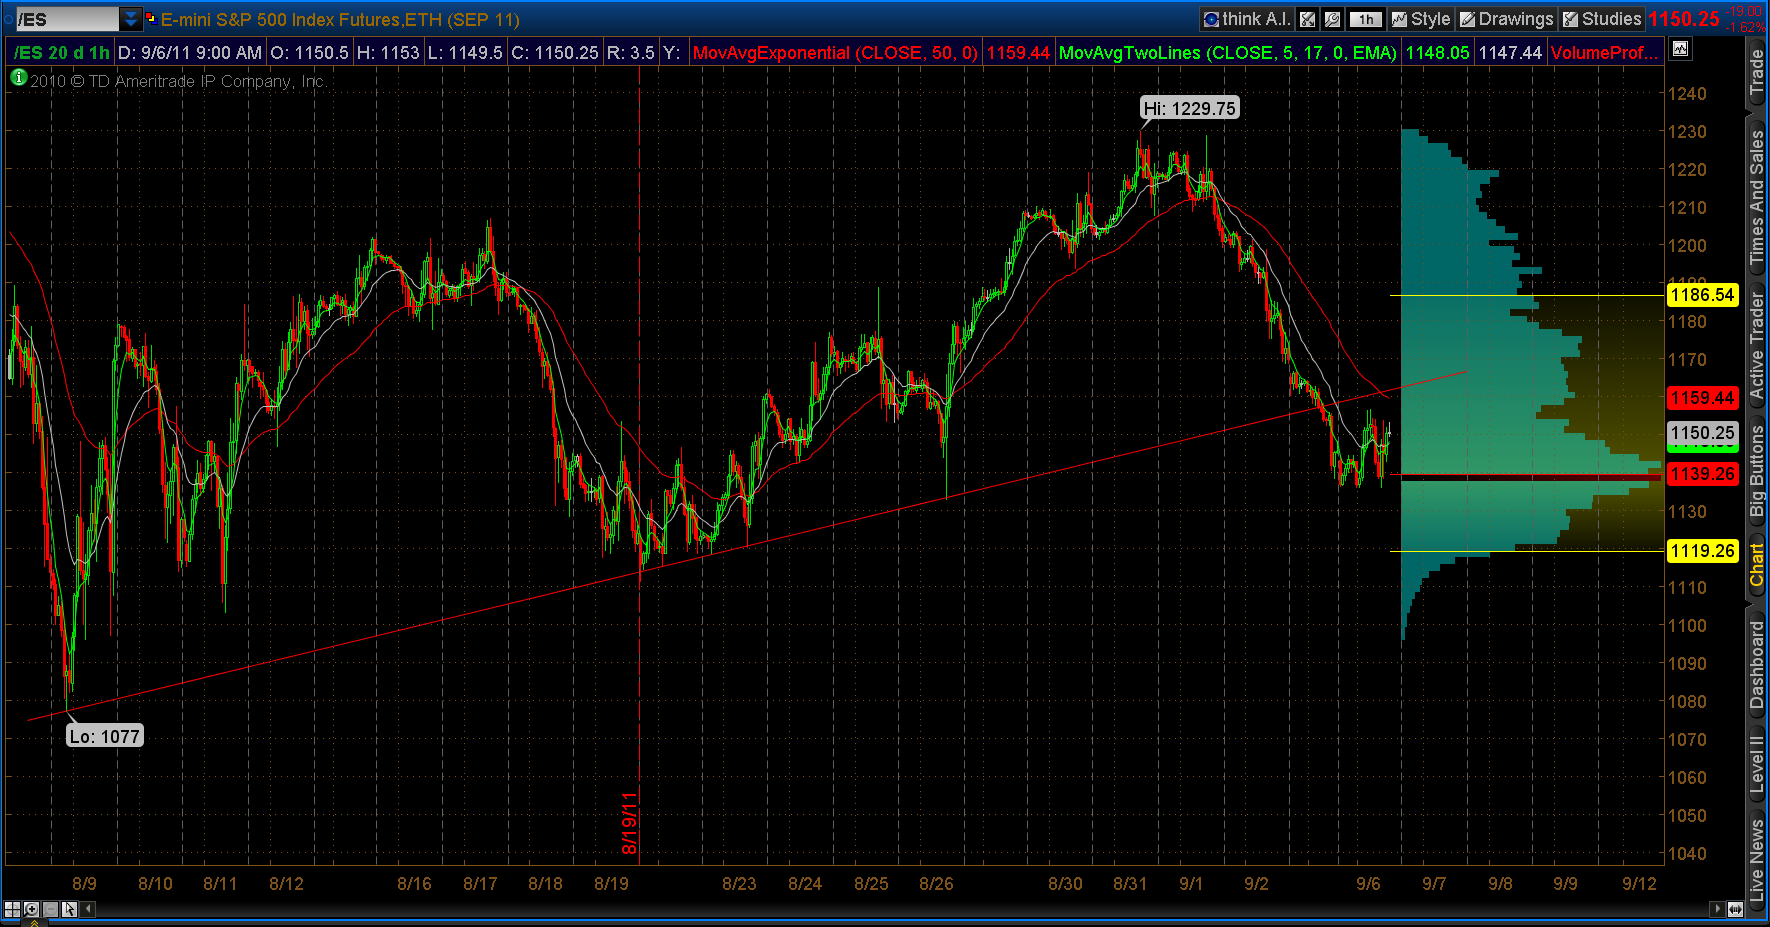
not necessarily, we tested 1139 three times - usually would make it a short-term bottom. With bonds paying so little, dividend stocks are well priced, earnings were good....etc.
However these days it is all Euro-news driven
However these days it is all Euro-news driven
1159.25 - top of the single print
I've been long most of the day targeting 1168 then 85. The euro has not been to my liking (whipsaws hh then ll hh) the past few weeks been trading the ES again. 30min ES is at the 20 period ema, but still making range extensions. as is the 15min. And 5 is holding near the highs each time with not many lower lows.
Also the 30min is bouncing very nice off its trend channel low (rth)
another long signal triggered a higher high on the 5min after 2 lower lows. 57.75
1159.25 filled
Originally posted by destiny
Thanks prestwickdrive for sharing. After reading your post, i looked into kool blue posts to get an understanding of these tools. Following is a note from one of kool blue posts. Looks like he is a scalper. My question to you is " Are you a scalper? or you use kool tolls to get maximum gains out of projected price levels".
" Predicting a turning point is frankly, not that difficult, but knowing if that turn will be 5 ticks or 500 is. That's why I'm a scalper . All I really care about is the next few minutes. Any way remember I commented on the cycles thread that I knew by around 10:15 that the market 'wanted' 984? Here's how that came about. Remember, the theory is that every initial move times 1.618 and added to the end of that initial thrust gives the point at which it will run out of gas so to speak."
Sorry for the delay in responding. I have been on the road and just saw your question. I scalp also and use the KT projectons as an aid for trade placement. If I could master better stop discipline I believe I could generate more trading profits by believing the KT projections and riding them for much more than a scalp. Perhaps someday ... :-)
Emini Day Trading /
Daily Notes /
Forecast /
Economic Events /
Search /
Terms and Conditions /
Disclaimer /
Books /
Online Books /
Site Map /
Contact /
Privacy Policy /
Links /
About /
Day Trading Forum /
Investment Calculators /
Pivot Point Calculator /
Market Profile Generator /
Fibonacci Calculator /
Mailing List /
Advertise Here /
Articles /
Financial Terms /
Brokers /
Software /
Holidays /
Stock Split Calendar /
Mortgage Calculator /
Donate
Copyright © 2004-2023, MyPivots. All rights reserved.
Copyright © 2004-2023, MyPivots. All rights reserved.