ES Monday 9-26-11
The numbers below are for Monday. The bold numbers are important S/Rs. the others are minor s/r. If you find congruency between the numbers posted below and the ones you got, and the market is trending in that direction, then it's most likely the market will hit it.
For Sep. 26. Monday
Buy above 1133.25
with 1137 / 1141.50 / 1145 / 1150 / 1154
Extreme 1158 /1162
as outside resistance and objectives.
Sell below 1128.75
with 1124 / 1120.25 / 1116.75 / 1112 / 1109
Extreme 1103 / 1095
as downside support and objectives.
As always, the market has the last word and in due time will show us the way.
I see for you the same I see for my self: having the very best of luck and a fun, awesome, profitable trading day!
Will stay out for a bit. --- IMO lots of money will need to come in to get this market up there. Will see what takes place during the next 20 minutes or so.
Lisa any big boys out there looking around
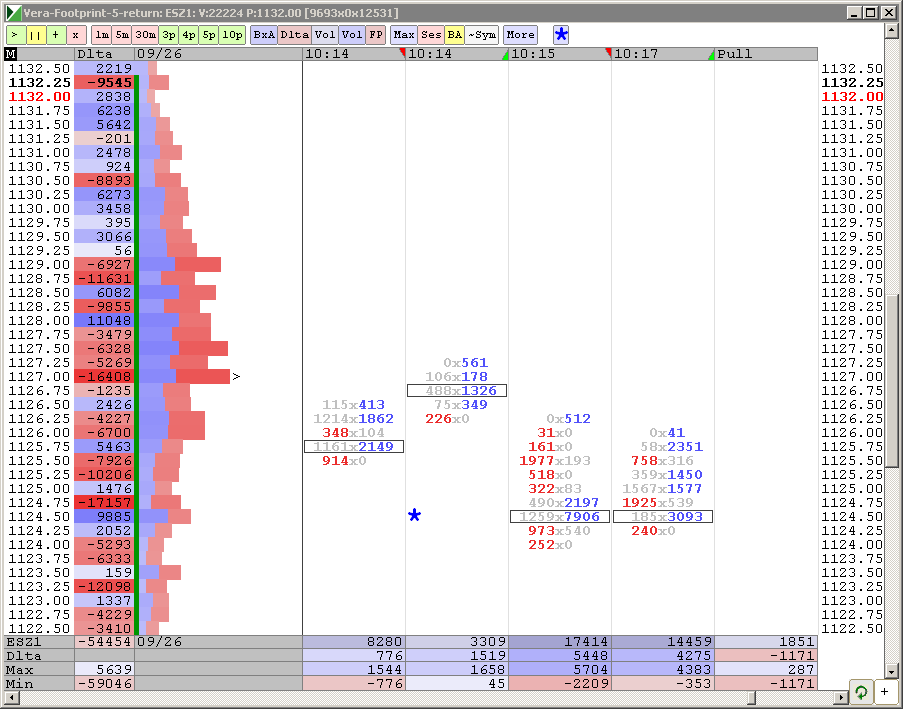
lisa bruce do you see at 33. 34. a low vol area there from today
Originally posted by della
lisa bruce do you see at 33. 34. a low vol area there from today
That was it. Otherwise Footprint shows thin trading. I did not take it as I have no "significant levels" in that area
Click image for original size
Originally posted by sandoxe
Originally posted by drakYes it is.
Im guessing the exact method of deriving these numbers is proprietary?
Della, Sandox posted something in this area, but I cannot use his numbers, as I do not understand them (proprietary).
where is everybody ?thanks lisa
Originally posted by della
where is everybody ?
guess trading...lol
I was refering to the numbers from Thursday and fridays combined RTH session only...all the volume is still in the 27 - 28 area so I expect to see those prices again....It will take some good volume to break it out of the 36 - 37 highs and then even greater volume to HOLD it outside that extreme....
The smart traders will take the mean reversion trade until they see the big volume step up for a VALID break out.....you can look to other markets to qualify a real breakout and sectors if you really want to go crazy with all this...
gaps in the data too...first one is at 33.75 ..second one is way down near 25.25....
seating on my hands. The reason why I'm not looking to buy is bc the 30 minutes chart is bearish. Since I'm looking for 10 points or more I have to go by it. If U r looking to scalp 3 or 5 points then the 10 minutes and lower charts are about right for the small swings that had taking place in the last hour.
ES now trading 1134.50 @ 11:12.
ES now trading 1134.50 @ 11:12.
well since we are all making projections here and predictions I'm putting my prediction on the 52.75 retest.....above this 61.25 area though I have 67.75, 71.75 and the big number at 76.50...real close to what you folks have posted...these are all fade points ....assuming I was awake...
Emini Day Trading /
Daily Notes /
Forecast /
Economic Events /
Search /
Terms and Conditions /
Disclaimer /
Books /
Online Books /
Site Map /
Contact /
Privacy Policy /
Links /
About /
Day Trading Forum /
Investment Calculators /
Pivot Point Calculator /
Market Profile Generator /
Fibonacci Calculator /
Mailing List /
Advertise Here /
Articles /
Financial Terms /
Brokers /
Software /
Holidays /
Stock Split Calendar /
Mortgage Calculator /
Donate
Copyright © 2004-2023, MyPivots. All rights reserved.
Copyright © 2004-2023, MyPivots. All rights reserved.