ES Thursday 9-29-11
I thought that we could use a refresher and some basics in case we have some new folks here. Most will know this stuff but hopefuly this will inspire some questions or help clear up any questions regarding the use of high and low volume in your analysis. Here is todays chart with the key areas labelled for Thursdays trade.
Click image for original size
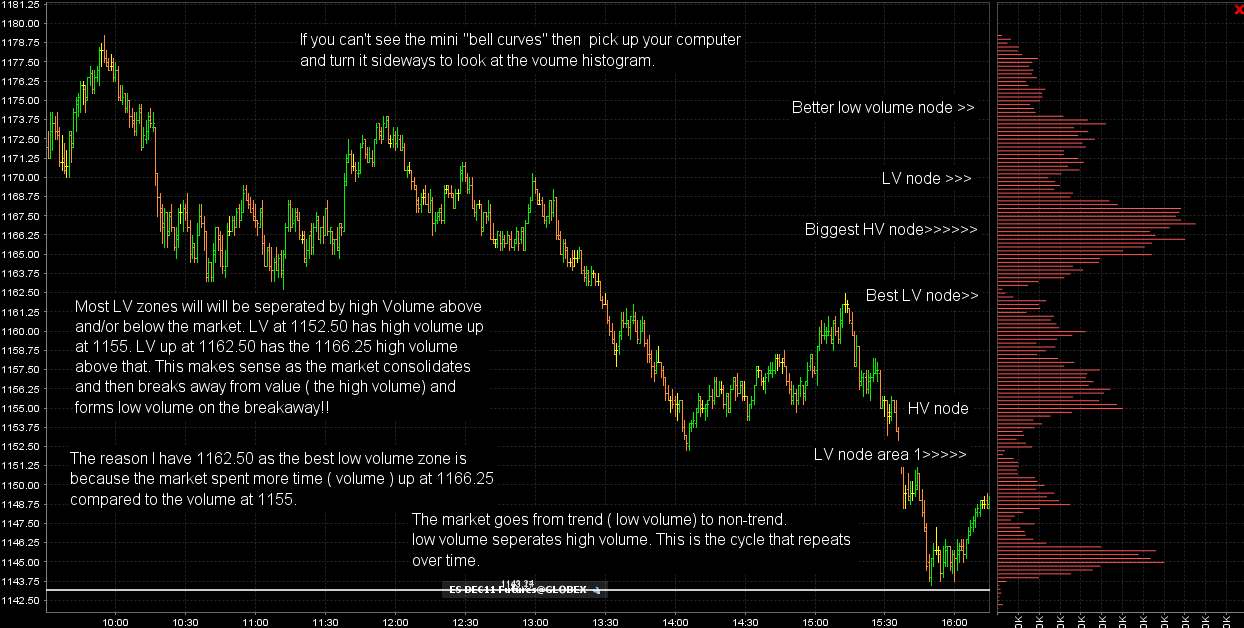
There are two types of volume that traders can watch (three actually if you use footprint/delta info).
First type of volume is the one plotted horizontally across the bottom of any chart. Volume at time.
Second type of volume is plotted vertically either on the left or right side of the chart. Volume at price or the volume profile.
For me personally, I prefer to use a 5 min chart when watching/studying volume profile.
I prefer to use a 1 min chart when watching volume at time or standard volume.
Both are important in my mind.
When preparing for the trading day I use the 5 min chart for my volume profile studies. Its personal preference though. If you want to use the 30 min chart its fine because volume profile is the same across any time frame. You will see the H/L nodes on any time frame you have the profile over.
As for books on volume trading, honestly, there isn't any. Dalton's Mind Over Markets is a book I highly recommend to understand Market Profile (MP) concepts which can be used for trading volume nodes. But there isn't a book out there that discusses what Bruce shows here on a daily basis.
I think after you spend some time with volume nodes you will develop your own personal feel as to how/what to use when trading volume nodes. It takes time and the patience to internalize the process. Believe me there is a huge difference between understanding this intellectually and knowing it in your heart (will). The two are vastly different but we all must first go through the intellectual stage first before our will takes over and its like driving a car...you just "know" how to do it.
Cheers!
Originally posted by khamore1
To BruceM. I have a few questions for you I appreciate your answer
What is the time frame for the Volume chart you posted today 9/29/2011
In general when you prepare for the next day trading and make your analysis based on volume high/low what time frame volume chart will be optimal to use if I trade on the 30 minute chart
Last question what is the best book about volume trading the Book that DT posted here about volume had mixed recommendation on the internet so I’m not sure which one to buy
Lorn I would appreciate your input as well
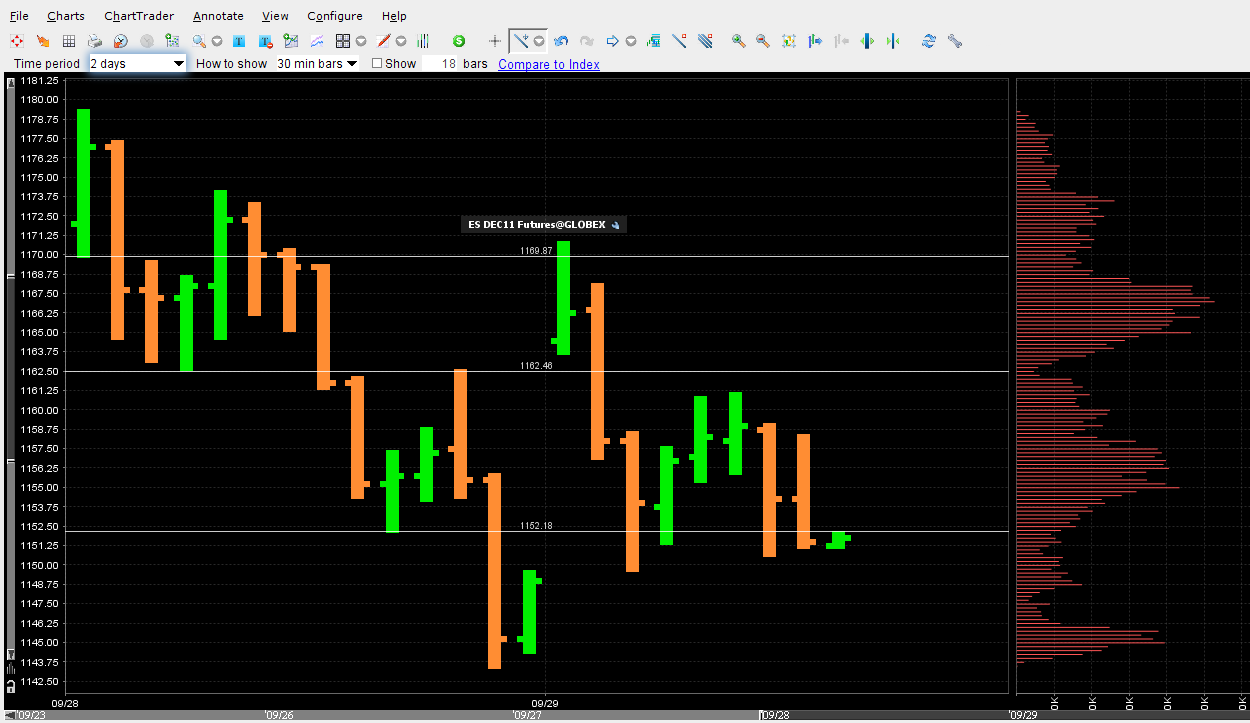
There was one at 1152 which is now filled.
Originally posted by della
Bruce you said there were a few singles from yesterday What was the price of them??
I show a Single Print at 63.50 does anyone see this? Thanks
often times low volume will become support or reistence once broken...here is a two day profile...look at our old friend at 62.50 and it is still low volume when we combine these two days...gap fill coming I think
Click image for original size
yes...I confirm
Originally posted by Futurestr8r
I show a Single Print at 63.50 does anyone see this? Thanks
In the chart posted yesterday I had the 50% daily and saying the significance of it. Today the ES is back above it but laking momentum to the outside. Below 1148 will target 1141 as first support and objective.
ES now trading 1149.00 at 13:34 E.T.
(DT pls check your e-mail Thx)
ES now trading 1149.00 at 13:34 E.T.
(DT pls check your e-mail Thx)
all my key areas are on the chart on page one....but we still need to watch that 43.75 at the lows if they can push that far today....and of course yesterdays high as that was at one time a key volume area.....we always keep track of the RTH lows and highs but some have more meaning!!
Originally posted by della
Bruce you said there were a few singles from yesterday What was the price of them??
Lorns comments are correct...no book on this.....just time in the trading trenches and constant review to see what works best...being flexible and not afraid to adapt.....that chart time frame does not matter....the volume stays the same..the histogram will look the same no matter if it is one minute, 5 minute or 30, 60...tic volume etc....I will help you some more later either here or in private
Originally posted by khamore1
To BruceM. I have a few questions for you I appreciate your answer
What is the time frame for the Volume chart you posted today 9/29/2011
In general when you prepare for the next day trading and make your analysis based on volume high/low what time frame volume chart will be optimal to use if I trade on the 30 minute chart
Last question what is the best book about volume trading the Book that DT posted here about volume had mixed recommendation on the internet so I’m not sure which one to buy
Lorn I would appreciate your input as well
can u show us specifically why your target is 41 besides that being the overnight low...I think that is what folks want from you...they want the nuts and bolts...that would go a long way Sand...we had lots of numbers mathc up with your swings from yesterday...very cool..
Originally posted by sandoxe
In the chart posted yesterday I had the 50% daily and saying the significance of it. Today the ES is back above it but laking momentum to the outside. Below 1148 will target 1141 as first support and objective.
ES now trading 1149.00 at 13:34 E.T.
(DT pls check your e-mail Thx)
so if a high or low lines up with a low volume area then pay even more attention to it...that is what all that babling really meant...LOL
Originally posted by BruceM
all my key areas are on the chart on page one....but we still need to watch that 43.75 at the lows if they can push that far today....and of course yesterdays high as that was at one time a key volume area.....we always keep track of the RTH lows and highs but some have more meaning!!Originally posted by della
Bruce you said there were a few singles from yesterday What was the price of them??
Trading strategy and setups are briefly given on the platform visit and get more useful information about any type of trading
Emini Day Trading /
Daily Notes /
Forecast /
Economic Events /
Search /
Terms and Conditions /
Disclaimer /
Books /
Online Books /
Site Map /
Contact /
Privacy Policy /
Links /
About /
Day Trading Forum /
Investment Calculators /
Pivot Point Calculator /
Market Profile Generator /
Fibonacci Calculator /
Mailing List /
Advertise Here /
Articles /
Financial Terms /
Brokers /
Software /
Holidays /
Stock Split Calendar /
Mortgage Calculator /
Donate
Copyright © 2004-2023, MyPivots. All rights reserved.
Copyright © 2004-2023, MyPivots. All rights reserved.