Volatility and Volume back in S&P
Here is an interesting concept that I have been working on. I want to say that I am pioneering the use of volume to create new brackets in Market Profile charts because I've never seen it done before. However, I'm sure that I'm not the first person to do this so I doubt that I am a pioneer here. Take a look at this chart.
What is this chart?
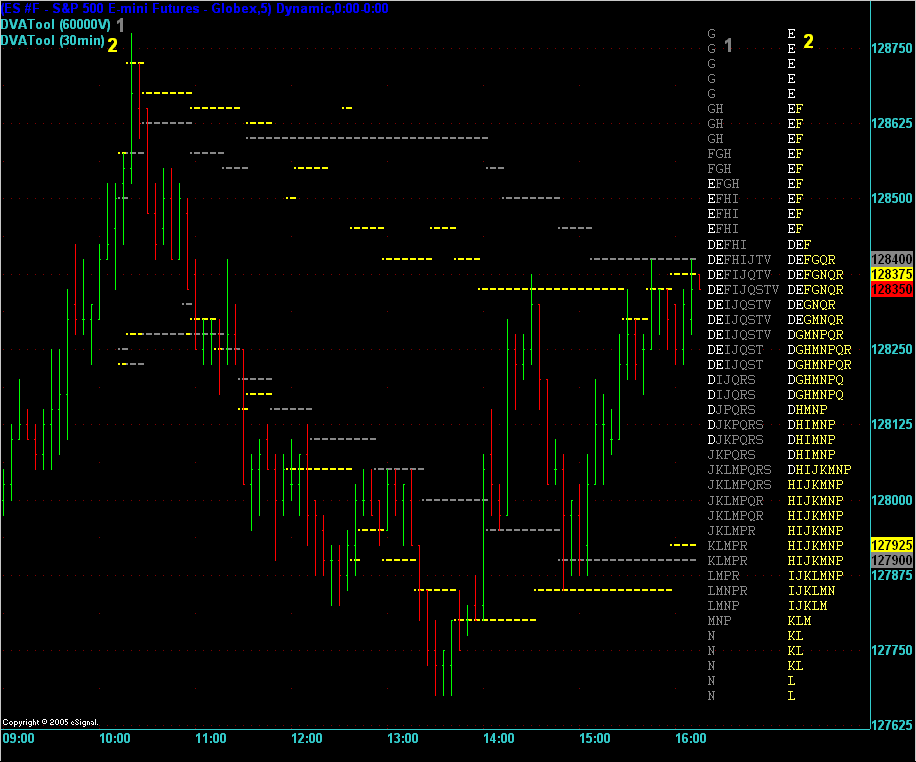
Okay, the chart is a 5 minute ES bar chart. Loaded onto this chart is 1 indicator but it has been loaded twice. The reason that it's been loaded twice is to allow us to look at the same market from two different angles.
I've marked the indicators (indicators are called studies in eSignal) as 1 and 2. Indicator 1 (grey) shows the Market Profile Graphic created by using volume to tell it when to switch to a new bracket. It starts a new bracket each 60,000 contracts. Indicator 2 (yellow) uses the traditional time base of 30 minutes. You can see the slightly different shapes that the 2 MP graphics. The volume based graphic is (1) weighted more on the upside and (2) has a smaller IB.
You can also see 2 pairs of lines on the chart. The yellow lines mark the Developing Value Area for the time based MP and the grey lines for the volume based MP.
As you can see, trading off the time based developing VA lines was more accurate and more profitable today than trying to use the volume based ones.
I was hoping to see the opposite happen. Why? Because I am exploring this for the first time and was hoping to find a new edge that I or anybody else had discovered. But I'm used to this now. I find that for every 20 trading theories/ideas that I come up with only 1 of them shows any true promise in the real world or a hit ratio of 5%. This is probably about right in almost every endeavour. How many calls does a telemarketer need to make before they make a sale? 19 No's to each Yes? Probably...
Anyway, I diverge. I just wanted to show you this new chart and way of looking at the market and see if anybody has any comments on it. I will of course be keeping an eagle eye on this to see if there are any further developments with this theory.
Another note: The number of brackets that will be created on any one day for the Volume based MP graphic will always change because the volume from open to close changes each day whereas the time between the open and close is always the same. So on high volume days we'll see more brackets and on low volume days we'll see fewer.
What is this chart?
Okay, the chart is a 5 minute ES bar chart. Loaded onto this chart is 1 indicator but it has been loaded twice. The reason that it's been loaded twice is to allow us to look at the same market from two different angles.
I've marked the indicators (indicators are called studies in eSignal) as 1 and 2. Indicator 1 (grey) shows the Market Profile Graphic created by using volume to tell it when to switch to a new bracket. It starts a new bracket each 60,000 contracts. Indicator 2 (yellow) uses the traditional time base of 30 minutes. You can see the slightly different shapes that the 2 MP graphics. The volume based graphic is (1) weighted more on the upside and (2) has a smaller IB.
You can also see 2 pairs of lines on the chart. The yellow lines mark the Developing Value Area for the time based MP and the grey lines for the volume based MP.
As you can see, trading off the time based developing VA lines was more accurate and more profitable today than trying to use the volume based ones.
I was hoping to see the opposite happen. Why? Because I am exploring this for the first time and was hoping to find a new edge that I or anybody else had discovered. But I'm used to this now. I find that for every 20 trading theories/ideas that I come up with only 1 of them shows any true promise in the real world or a hit ratio of 5%. This is probably about right in almost every endeavour. How many calls does a telemarketer need to make before they make a sale? 19 No's to each Yes? Probably...
Anyway, I diverge. I just wanted to show you this new chart and way of looking at the market and see if anybody has any comments on it. I will of course be keeping an eagle eye on this to see if there are any further developments with this theory.
Another note: The number of brackets that will be created on any one day for the Volume based MP graphic will always change because the volume from open to close changes each day whereas the time between the open and close is always the same. So on high volume days we'll see more brackets and on low volume days we'll see fewer.
1. did you program this yourself?
2. what you are trying to capture is effectively cap flow but why use 60k why not use 10k
3. Re developing VA for your lines you forgot to add POC
4. I am looking for a T/S eld programmer. Know anyone especially one who wants to do what I want not what they want
2. what you are trying to capture is effectively cap flow but why use 60k why not use 10k
3. Re developing VA for your lines you forgot to add POC
4. I am looking for a T/S eld programmer. Know anyone especially one who wants to do what I want not what they want
Hi Alex,
> 1. did you program this yourself?
Yes
> 2. what you are trying to capture is effectively cap flow but why use 60k why not use 10k
60k matched (approximately) the number of brackets that would be generated in a time based MP graphic. So I wanted to look at the MP graphic in a similar way but eliminate any quite periods in time.
> 3. Re developing VA for your lines you forgot to add POC
I purposely switched off the POC line because I didn't want the chart to become too cluttered. I was trying to keep the example as simple as possible. I usually have the POC (or DPOC as I call it) on the chart as well.
> 4. I am looking for a T/S eld programmer. Know anyone especially one who wants to do what I want not what they want
There's a guy that I used to chat with on IRC by the nick deMicron who seems to be good at that sort of thing. I've just taken a look at his site (www.dowemini.com) and see that he has a market profile looking think on his charts so he's probably familiar with MP and the concepts in programming it in ELD already so that might be a starting point for you. I'm going to send him an email and point him to this topic and suggest that he posts here or replies directly to you.
I don't work in EasyLanguange (much) so I don't know what a good or bad EL programmer would look like so can't vouch for anyone. The casual dealings I had with deMicron gave me the impression that he was an honest and reputable person.
This is what it says on his TradeStation page:
deMicron's TradeStation Software
We have written Thousands of Indicators, Strategies, Functions in EL/Java/C++/CFM with extensive SQL and Graphics Apps. But here are some which interest TradeStation Community!
Emini Day Trading /
Daily Notes /
Forecast /
Economic Events /
Search /
Terms and Conditions /
Disclaimer /
Books /
Online Books /
Site Map /
Contact /
Privacy Policy /
Links /
About /
Day Trading Forum /
Investment Calculators /
Pivot Point Calculator /
Market Profile Generator /
Fibonacci Calculator /
Mailing List /
Advertise Here /
Articles /
Financial Terms /
Brokers /
Software /
Holidays /
Stock Split Calendar /
Mortgage Calculator /
Donate
Copyright © 2004-2023, MyPivots. All rights reserved.
Copyright © 2004-2023, MyPivots. All rights reserved.