ES Monday 10-31-11
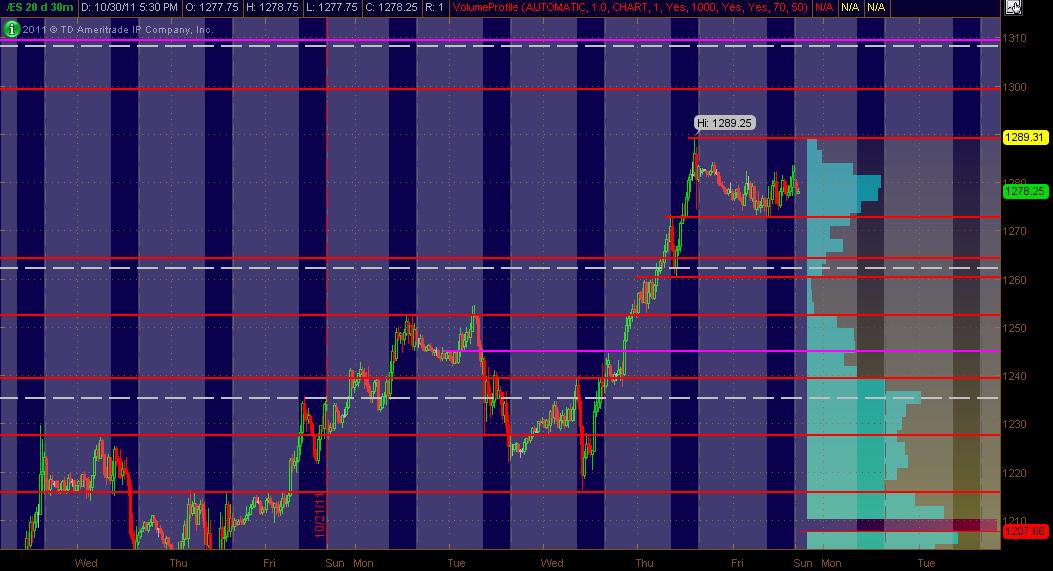
Here's my 20 days worth of 30min chart action displaying All Trading Hours as a MAP of what I'm looking at coming into Monday. The Red lines are potential significant PASR levels with Magenta lines being semi-significant. The White dashed lines are the Wkly Pivots. The right vertical axis shows 20 days of Volume Profile in Light Blue. The background displays RTH in Blue with "after hours" in Gray. Hope this is helpful for some folks.
Click image for original size
Short since the open (IDNR4) stop now at breakeven looking for 1259.50.
good example of building hV in a LV area from a previous day...
best trade will come if they push down with air pockets into the 59 - 60 now...I'd like to see that to get a better long working...that would create POTENTIAL single prints too
best trade will come if they push down with air pockets into the 59 - 60 now...I'd like to see that to get a better long working...that would create POTENTIAL single prints too
my IB $ticks are frozen today...like doing the trapeze without a net!!
bias is still long but needing to go small
bias is still long but needing to go small
trying to getto 65.75...LV there and in front of that 66 number!!..tough day for any trends..
moving first target to 65
Stopped Out b/e
took open print...holding one to see if i can get 71 !! without those $ticks, I am lost but ideal will need to see if 65 - 66 can turn into support on the next retrace down
flat at 64.75
the more they keep it under that 66 area from thursdays breakout long then the more dangerous all our long fades are now and it increases the odds of further selling...that is the obvious point to beat if longs want to take over...
I will not fade short if they break out the hour highs unless they can push up into 71...I will still fade long if they push out the hour lows into that 59 - 60 but will be more careful
I will not fade short if they break out the hour highs unless they can push up into 71...I will still fade long if they push out the hour lows into that 59 - 60 but will be more careful
Originally posted by BruceM
my IB $ticks are frozen today...like doing the trapeze without a net!!
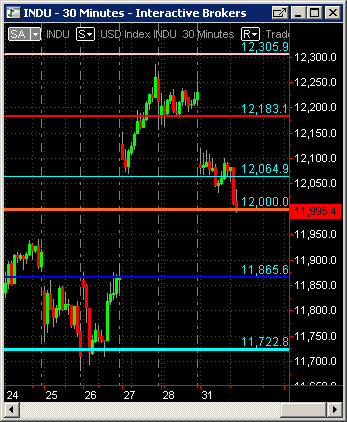
Bruce, IB $TICK works here
Careful with shorts here
Click image for original size
Emini Day Trading /
Daily Notes /
Forecast /
Economic Events /
Search /
Terms and Conditions /
Disclaimer /
Books /
Online Books /
Site Map /
Contact /
Privacy Policy /
Links /
About /
Day Trading Forum /
Investment Calculators /
Pivot Point Calculator /
Market Profile Generator /
Fibonacci Calculator /
Mailing List /
Advertise Here /
Articles /
Financial Terms /
Brokers /
Software /
Holidays /
Stock Split Calendar /
Mortgage Calculator /
Donate
Copyright © 2004-2023, MyPivots. All rights reserved.
Copyright © 2004-2023, MyPivots. All rights reserved.