ES Monday 6-27-16
Weakness of Friday has spilled into Monday already.
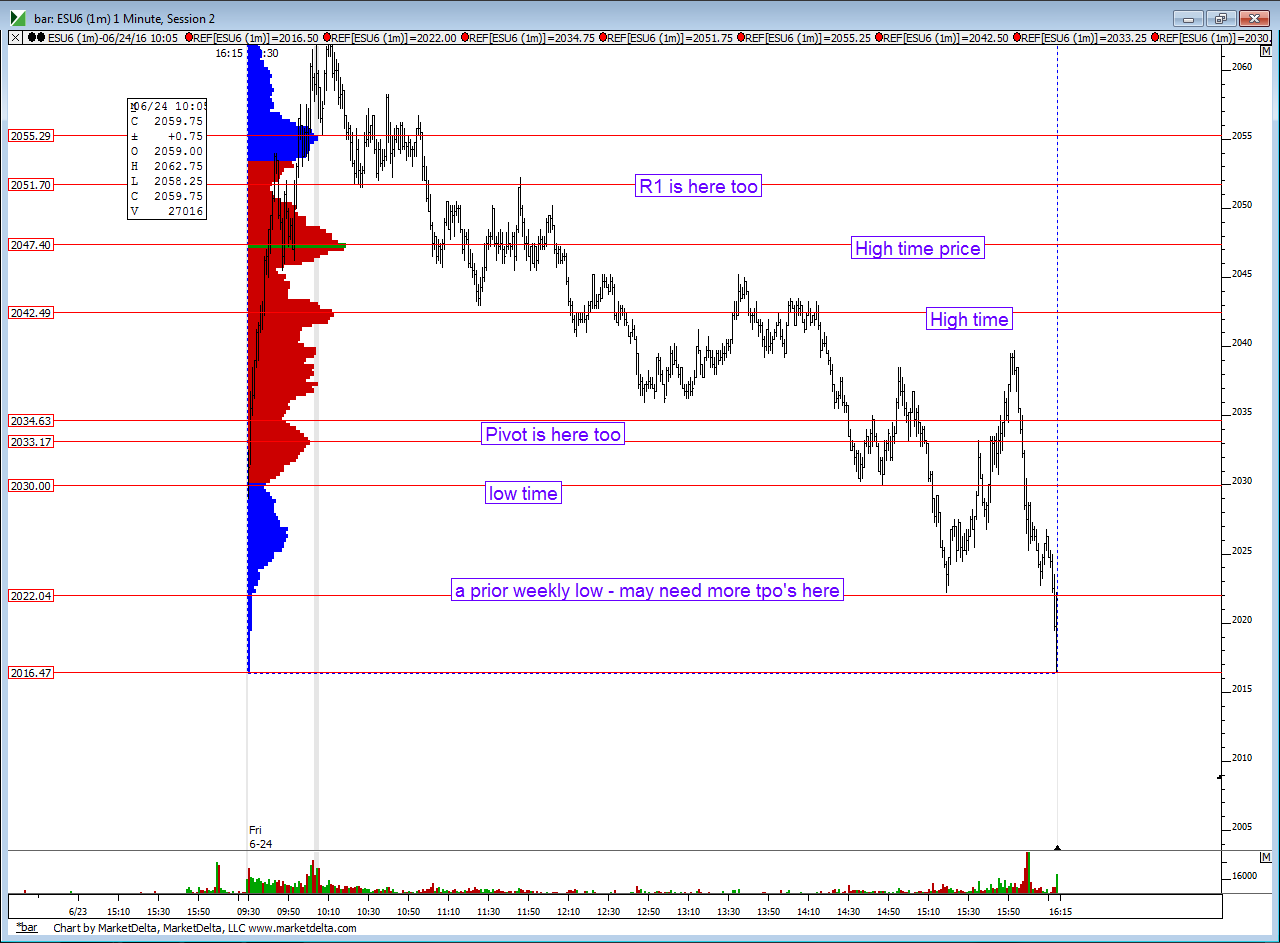
Overnight high goes well with 4:15 close of Friday at 2022 and this is a prior weeks low. I generally like to see multiple tpo's at weekly breakout or breakdown points..
European open goes well with Friday lows at 2016 so using 2014 - 2016 as an area. We also have a daily swing low from 5-19 here !
besides the overnight low as a reference I will be using 2007.50 as a possible magnet...lots of volume in the overnight has passed through this point !
S1 today is at 2004.25 so many will be using 2004.25 - 2007.50 as a bigger bull bear line .
Here is Friday with the most relevant lines.....we are set to open out of this range so I will include the overnight too and edit this post.
overnight as I type
a longer term idea...generally we hit some weekly floor trader number also about 95 % of the time ....we will be opening between the weekly pivot of 2048 and the s1 at 1989.75 ( daily s2 is at 1986 for confluence should we drop down there today) so the probability says that by weeks end one of those will print...may or may not be useful to some reading this
I really like the idea of trading to the long side today especially if we open under last weeks lows....that would put us breaking down from TWO weekly lows as we broke down from the 2022 low late on Friday and I think they may need to know about that some more but also we will be opening under last weeks lows of 2016.....so odds favor a retest up to check out at least one of those areas. I will be using 2007.50 and 2004.25 as my POSSIBLE support points to get long. If you take the 2004 area then obviously you need to scale something at the 2007 area just in case it becomes resistance. If you take the 2007.50 then scale at the weekly low from back in March at the 2011.50 area just in case that becomes resistance too...so lets not be pigs just because ranges are bigger...u can see this area as a spot on my overnight chart that I didn't mark...but time has been trading back and forth there
Overnight high goes well with 4:15 close of Friday at 2022 and this is a prior weeks low. I generally like to see multiple tpo's at weekly breakout or breakdown points..
European open goes well with Friday lows at 2016 so using 2014 - 2016 as an area. We also have a daily swing low from 5-19 here !
besides the overnight low as a reference I will be using 2007.50 as a possible magnet...lots of volume in the overnight has passed through this point !
S1 today is at 2004.25 so many will be using 2004.25 - 2007.50 as a bigger bull bear line .
Here is Friday with the most relevant lines.....we are set to open out of this range so I will include the overnight too and edit this post.
Click image for original size
overnight as I type
Click image for original size
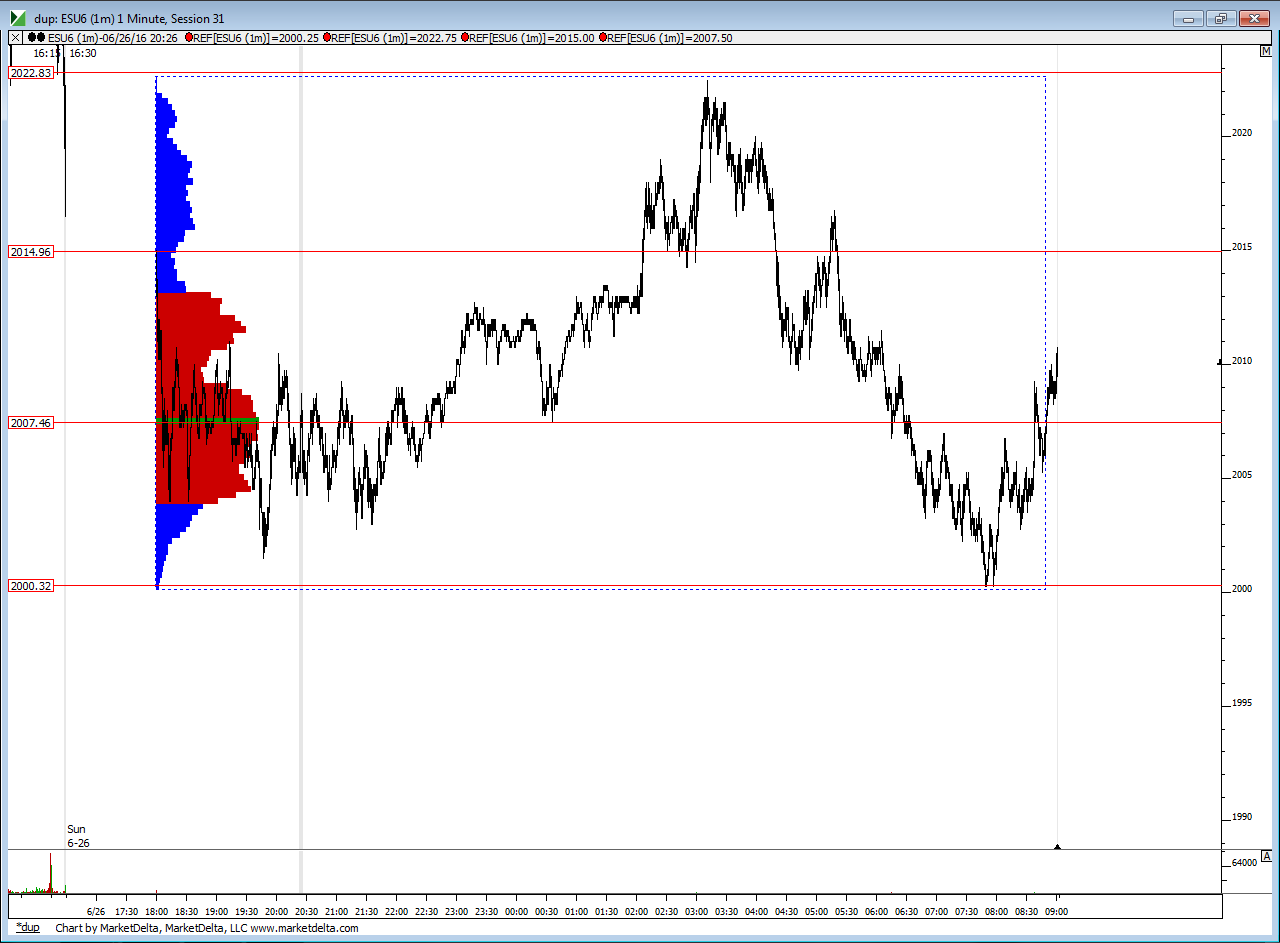
a longer term idea...generally we hit some weekly floor trader number also about 95 % of the time ....we will be opening between the weekly pivot of 2048 and the s1 at 1989.75 ( daily s2 is at 1986 for confluence should we drop down there today) so the probability says that by weeks end one of those will print...may or may not be useful to some reading this
I really like the idea of trading to the long side today especially if we open under last weeks lows....that would put us breaking down from TWO weekly lows as we broke down from the 2022 low late on Friday and I think they may need to know about that some more but also we will be opening under last weeks lows of 2016.....so odds favor a retest up to check out at least one of those areas. I will be using 2007.50 and 2004.25 as my POSSIBLE support points to get long. If you take the 2004 area then obviously you need to scale something at the 2007 area just in case it becomes resistance. If you take the 2007.50 then scale at the weekly low from back in March at the 2011.50 area just in case that becomes resistance too...so lets not be pigs just because ranges are bigger...u can see this area as a spot on my overnight chart that I didn't mark...but time has been trading back and forth there
these areas will be important but I don't know WHEN they will be important but here they are for reference,,,note the two bells ...we only need one good trade to make up for the 2 clunkers!!
Click image for original size
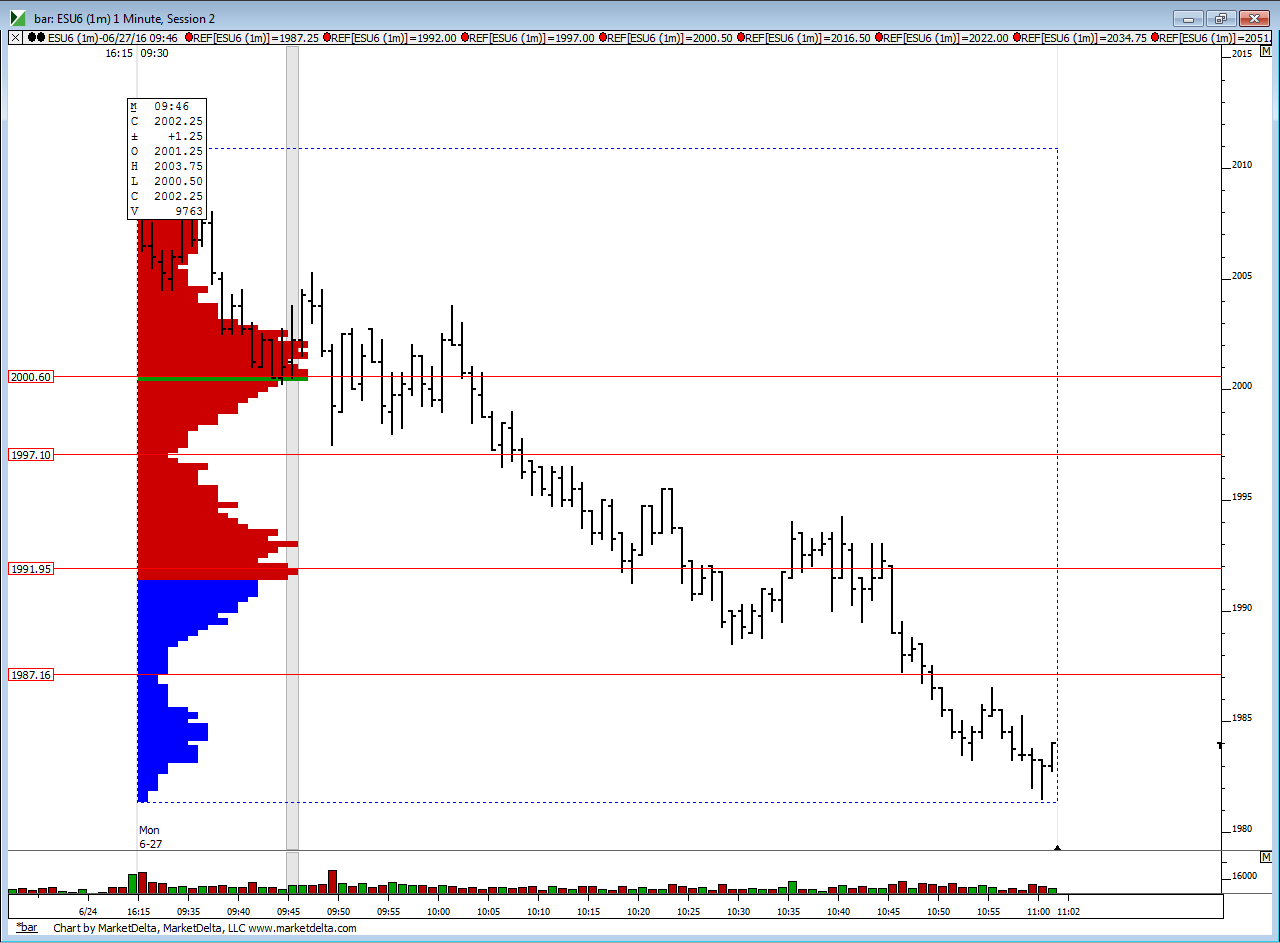
so ideally now we'd need to see weak pushes down off that low time spot in order to go get the 91 area...we want to get back inside lower bell curve edge lows !!
key point...it's ok be wrong and often on days that trend.......just keep those losses small and try again....only runners on and will call it a day...so no more initiating...gotta go beat the kids ....LOL!.
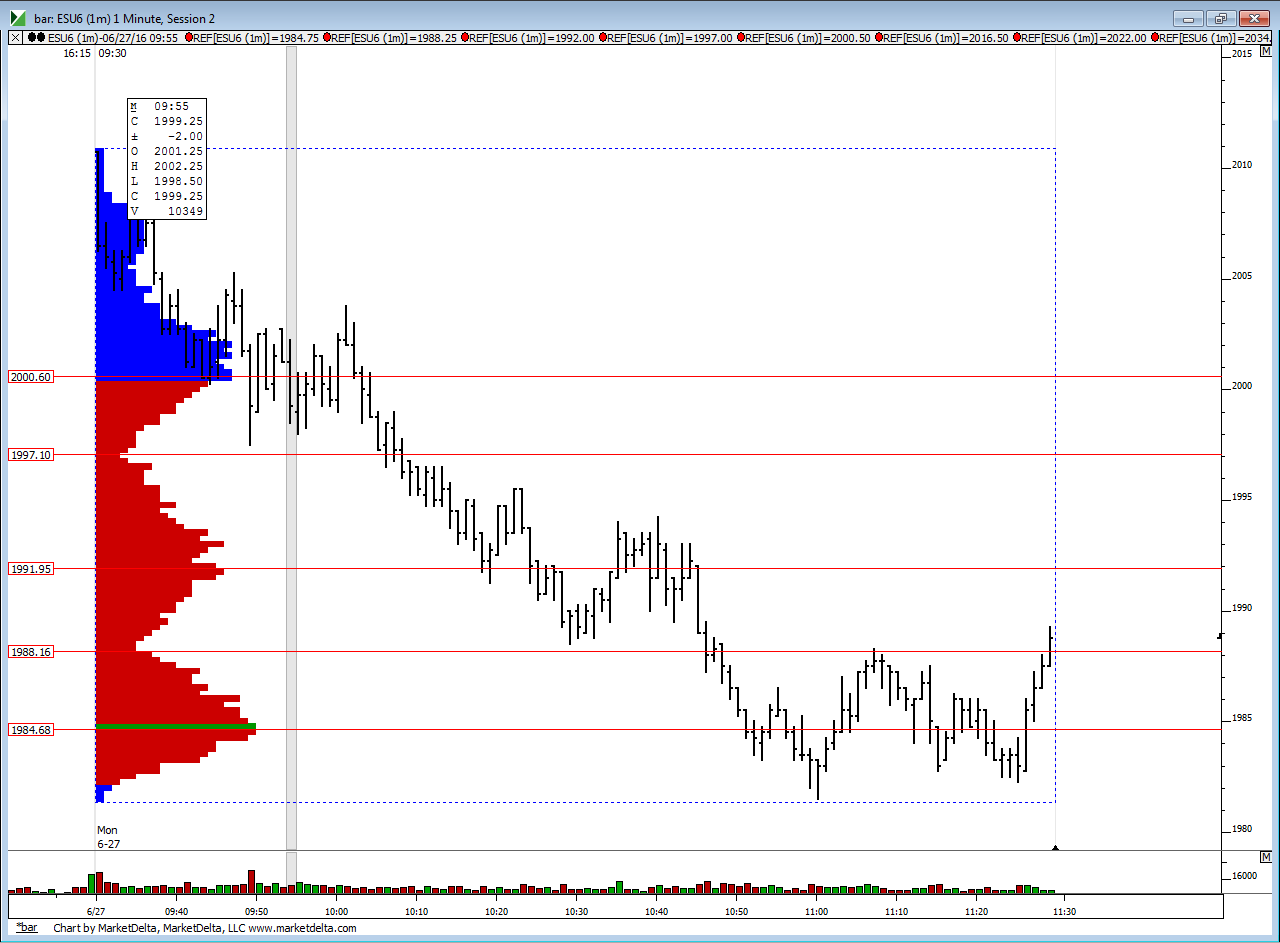
one last thing...the point of control on the one minute just jumped from 2000.50 to 1984.75...this is time.......so now the question for anyone left trading would be this
"does this poc flip mean we are accepting the lower prices or are we spending too much time down here now without sellers getting rewarded?"
this is a time flip not a VPOC flip and may have very different implications !!
I think it implies that sellers are tiring
"does this poc flip mean we are accepting the lower prices or are we spending too much time down here now without sellers getting rewarded?"
this is a time flip not a VPOC flip and may have very different implications !!
I think it implies that sellers are tiring
really gotta go beat those kids but now three bells...very unusual and we won't end the day looking like this...I'm hoping they clean up some of those bells on the upside...ok nuff said...not over managing any of this and have calls on anyway....
Click image for original size
that's final target at 90 for me.....missed runners stop by one tick..usually it happens the opposite where I am taken out by one tic and then market goes in my direction...today was lucky and it worked in my favor...
Nice explanation on POC vs VPOC Bruce, I thought a shift lower normally implies lower prices but in this case you were right, buyers stepped in. The price action has changed since then but good assessment on your part.
Sharks
Sharks
Emini Day Trading /
Daily Notes /
Forecast /
Economic Events /
Search /
Terms and Conditions /
Disclaimer /
Books /
Online Books /
Site Map /
Contact /
Privacy Policy /
Links /
About /
Day Trading Forum /
Investment Calculators /
Pivot Point Calculator /
Market Profile Generator /
Fibonacci Calculator /
Mailing List /
Advertise Here /
Articles /
Financial Terms /
Brokers /
Software /
Holidays /
Stock Split Calendar /
Mortgage Calculator /
Donate
Copyright © 2004-2023, MyPivots. All rights reserved.
Copyright © 2004-2023, MyPivots. All rights reserved.