ToolPack - DVATool
A new tool has been added to the ToolPack today. The DVATool is the Developing Value Area Tool. This EFS tracks the developing Value Area (high and low - aka VAH and VAL) and the POC (point of control) on a normal bar chart - i.e. bringing Market Profile lines to a bar chart. It allows you to see how the developing VA and POC have changed over the day.
The beta version of this tool was released today. More info on it here:
http://www.deltat1.com/mp/toolpack/dva_tool.htm
Please post your support questions and comments in this topic.
The beta version of this tool was released today. More info on it here:
http://www.deltat1.com/mp/toolpack/dva_tool.htm
Please post your support questions and comments in this topic.
6 May 2005
Update: The DVATool has gone through a number of improvements since it was first released as a beta study. (The DVATool is still a beta study tool.) Another version has been uploaded to the web and the whole ToolPack for eSignal 7.9 can be downloaded from here:
http://www.deltat1.com/mp/toolpack/download.htm
WARNING: If you're not running eSignal 7.9 then don't download this ToolPack as it will only work on eSignal 7.9
Most recent changes in this version: The POC for the DVATool is now in line with the POC as it is calculated in eSignal's Market Profile chart. The DVAH and DVAL are still slightly different due to slightly different algorithms being used but hopefully that will be brought in line soon.
Still to look forward to: I will be adding VAH, POC, and VAL to this tool. Here is a sneak preview of what is to come. The DVAH, DPOC, DVAL carry forward to the next day and become the VAH, POC, and VAL as you would expect. Their color has changed as you can see. All of this is (will be) configurable so you can disable any of the lines as well as changing their color, thickness, style and type.
Click image for original size
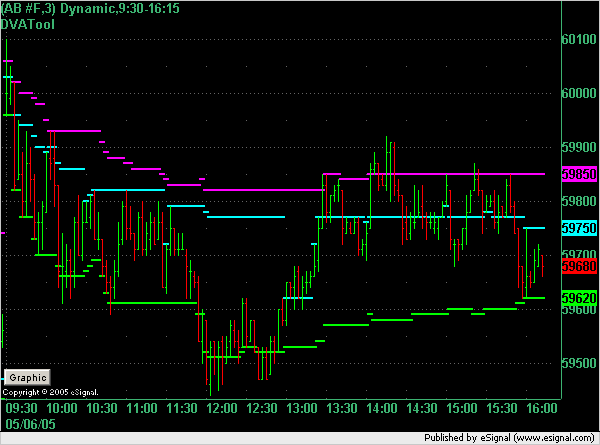
Developing Value Area and Point of Control in the ER2 during 6 May 2005. The chart is a 3 minute bar chart from 09:30 to 16:15 EST.
Click image for original size
Emini Day Trading /
Daily Notes /
Forecast /
Economic Events /
Search /
Terms and Conditions /
Disclaimer /
Books /
Online Books /
Site Map /
Contact /
Privacy Policy /
Links /
About /
Day Trading Forum /
Investment Calculators /
Pivot Point Calculator /
Market Profile Generator /
Fibonacci Calculator /
Mailing List /
Advertise Here /
Articles /
Financial Terms /
Brokers /
Software /
Holidays /
Stock Split Calendar /
Mortgage Calculator /
Donate
Copyright © 2004-2023, MyPivots. All rights reserved.
Copyright © 2004-2023, MyPivots. All rights reserved.