I assume that you're shorting the Dow not the ES Bruce? Good luck!
DA
day trading
Rep: 39,586
Posts: 6,369
0
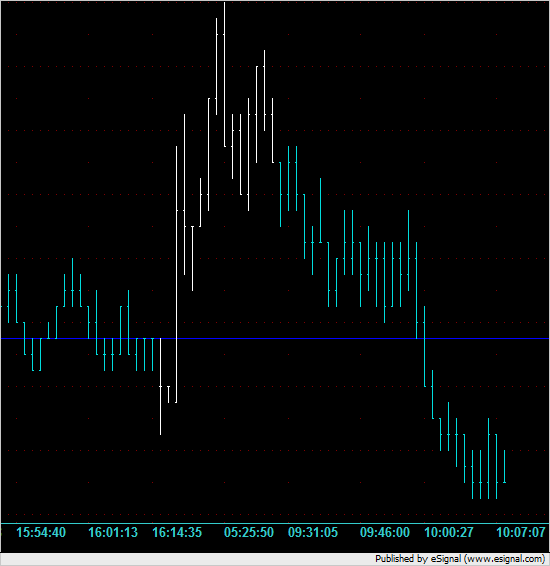
For the record, this is what happened on the fourth day. The white bars are the overnight action. The cyan bars to the left are Friday's prices and the cyan to the right are Monday morning's RTH bars. The horizontal blue line is the gap fill line. The chart is a 6,000V chart (i.e. new bar every 6,000 contracts).
Click image for original size
DA
day trading
Rep: 39,586
Posts: 6,369
0
I've just realized that I cut off the prices on the right hand side. Sorry about that but it doesn't really matter as we can see the net result of the trade/pattern.
BR
BruceM
Rep: 216,211
Posts: 19,895
0
Correct..a fun little trade..I think most of us don't put enough emphasis on the cash markets and when they return to "Unchanged " levels from the previous session...perhaps the subject of another thread at another time...sorry to chime in here with something unrelated to your thread...
Bruce
quote:Originally posted by day trading
I assume that you're shorting the Dow not the ES Bruce? Good luck!
DA
day trading
Rep: 39,586
Posts: 6,369
0
Your comments are welcome. You were playing the gap which this thread is about. All of the Dow stocks are in the S&P500 so you were just playing a subset of the ES gap trade.
PO
poster
Rep: 0
Posts: 69
0
BruceM, could you elaborate a bit on how you used the cash market with Monday morning's trade? Thnx...