Discrepencies in Market Profile in eSignal
Greetings Guys,
I wanted to see if anyone has noticed that the eSignal Market Profile data is typically a little different than the rest of the trading world, specifically, THIS FORUM's posts by DayTradr.
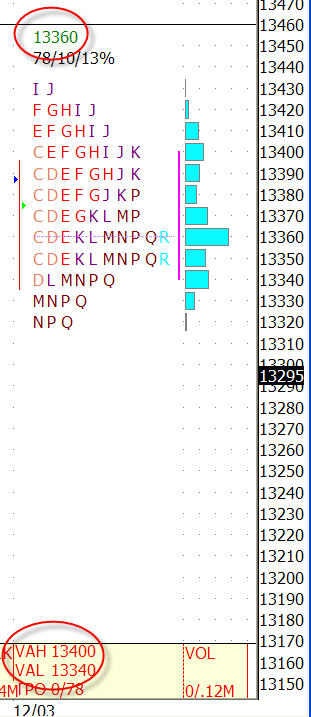
For example, on MY GAP Chart (930-1630), 30M for the YM Z7 Market Profile Chart, I show the following for Dec 4th:
VAH 13400
POC 13360
VAL 13340
With that said, I am getting slightly different info from DayTrader, whom I believe also uses eSignal for the Market Profile Data:
VAH 13395
POC 13353
VAL 13335
Does anyone know how this can happen?
DayTrader, are you using eSignal charts? if so, what am I missing here?
Attached is a snapshot of what i am looking at.
I wanted to see if anyone has noticed that the eSignal Market Profile data is typically a little different than the rest of the trading world, specifically, THIS FORUM's posts by DayTradr.
For example, on MY GAP Chart (930-1630), 30M for the YM Z7 Market Profile Chart, I show the following for Dec 4th:
VAH 13400
POC 13360
VAL 13340
With that said, I am getting slightly different info from DayTrader, whom I believe also uses eSignal for the Market Profile Data:
VAH 13395
POC 13353
VAL 13335
Does anyone know how this can happen?
DayTrader, are you using eSignal charts? if so, what am I missing here?
Attached is a snapshot of what i am looking at.
Click image for original size
I stopped using eSignal a few years ago because it had bugs and was reporting incorrect values for VAH, POC and VAL. It was missing high and low ticks fairly often. I'm not sure if they ever fixed those bugs and they do not publish the algorithm that they use. My belief is that they still are not accurate and the reason that they don't publish the algorithm is because it would be easy to point out to them that their figures don't tie in with the algorithm that they claim to use.
the algorithm is no secret, the way they calculate it is not very accurate and this is known by by a few people :)
IRT has two methods for calculation, Method A will basically give you e-signal values and Method B will basically give you CQG values (Method B is the more accurate one)
IRT has two methods for calculation, Method A will basically give you e-signal values and Method B will basically give you CQG values (Method B is the more accurate one)
Emini Day Trading /
Daily Notes /
Forecast /
Economic Events /
Search /
Terms and Conditions /
Disclaimer /
Books /
Online Books /
Site Map /
Contact /
Privacy Policy /
Links /
About /
Day Trading Forum /
Investment Calculators /
Pivot Point Calculator /
Market Profile Generator /
Fibonacci Calculator /
Mailing List /
Advertise Here /
Articles /
Financial Terms /
Brokers /
Software /
Holidays /
Stock Split Calendar /
Mortgage Calculator /
Donate
Copyright © 2004-2023, MyPivots. All rights reserved.
Copyright © 2004-2023, MyPivots. All rights reserved.