Tuesday 12-04-2007
New trading day means new opportunities !
Gap down opening on the stock futures.
Seeing a bit of a bounce back up into the gap.
ER2 has formed what appears to be a possible V bottom on the 5 minute time frame.
In the ES, 1470 is a bit of resistance from overnight. Overnight singles from the gap at 1472.25 along with the prior day's LOD sitting there. ES 1473-74 looks like a resistance zone if the market is able to rally up to that level.
NQ is showing relative strength on the bounce.
markets stalled at the overnight resistance zone
ES formed a little double top at 1471.50 on the faster time frames. I did not take the setup, primarily due to that V bottom sitting down there off the open...I don't want to get into the mode of picking tops in a slowly creeping uptrend...thus will need to see a clear trendline break by the NQ and ER2 to shift to a short bias.
ES formed a little double top at 1471.50 on the faster time frames. I did not take the setup, primarily due to that V bottom sitting down there off the open...I don't want to get into the mode of picking tops in a slowly creeping uptrend...thus will need to see a clear trendline break by the NQ and ER2 to shift to a short bias.
pretty choppy trading... third test of 71-72 zone was rejected with a bit more force that time
ok took a little long here in the NQ at 67.50
looking for ES to break the 71.50 barrier and wake-up some short covering
looking for ES to break the 71.50 barrier and wake-up some short covering
ES is testing 70.50 now, pulling my stop up just in case the market rejects the test...hoping for a punch through resistance...in either case this test should set the tone for the afternoon trading session.
just noticed on the all sessions 5 minute chart of the ES is showing an inverse head and shoulders pattern, our 1470.50 resistance level forms the neckline... a breakout should take us up to test the singles
ES has punched on through resistance and touched the singles at 72.25, so the initial objective of this trade has been met.
Exited the NQ long trade at 2072.50 +5
market trading back down through the 1470.25 neckline in the ES, suggests to me a retest of the morning lows may be in the cards this afternoon
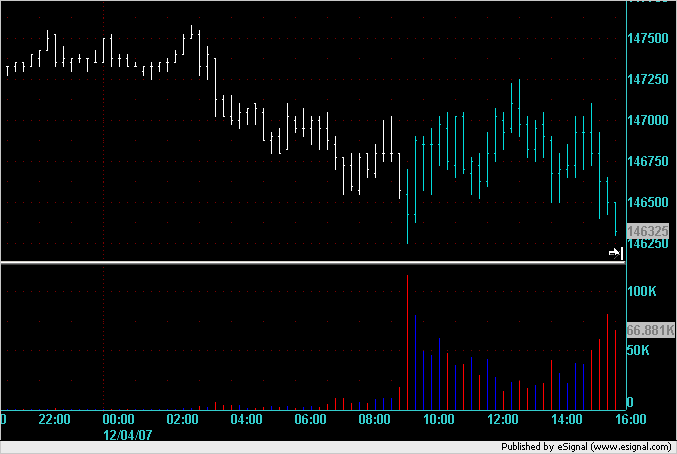
Here's a chart of the action today to put what PT is saying in context. 15 minute bars. The white bars are overnight action and the cyan bars are RTH.
Click image for original size
thanks DT !
for some reason I cannot see the charts on here lately ?
for some reason I cannot see the charts on here lately ?
Strange, I'm also using Firefox but I can see them. I'm using version 2.0.0.11 - what version are you using? And do you have any AddIns loaded?
Emini Day Trading /
Daily Notes /
Forecast /
Economic Events /
Search /
Terms and Conditions /
Disclaimer /
Books /
Online Books /
Site Map /
Contact /
Privacy Policy /
Links /
About /
Day Trading Forum /
Investment Calculators /
Pivot Point Calculator /
Market Profile Generator /
Fibonacci Calculator /
Mailing List /
Advertise Here /
Articles /
Financial Terms /
Brokers /
Software /
Holidays /
Stock Split Calendar /
Mortgage Calculator /
Donate
Copyright © 2004-2023, MyPivots. All rights reserved.
Copyright © 2004-2023, MyPivots. All rights reserved.