...keep the ideas flowing
President Bush is scheduled to announce the housing market bailout plan today, so if recent market history is any indication the market should be firm leading into his announcement.
...plan for the day: stay flexible and wait for confirmation !
PT
pt_emini
Rep: 5,707
Posts: 1,940
ES is stuck between this 92 level and the VAH
sitting on hands, no trades yet
sitting on hands, no trades yet
PT
pt_emini
Rep: 5,707
Posts: 1,940
NQ is not showing much buying interest so far this morning, especially when viewed in relation to the strength in the ER2
BR
BruceM
Rep: 216,211
Posts: 19,895
got stopped on runners at 89.25 on that short..just shorted 94.25..new highs will take me out otherwise trying foir 92.25..I missed the 95 short so this may cost me...
BR
BruceM
Rep: 216,211
Posts: 19,895
I'd like to bring up the point of distractions: Had I been at the computer instead of helping my wife get the house ready for my mother -in-laws visit, I would have sold at or closer to the 95 price and would have exited this last trade at a profit.......
I just exited at 95.25 as I'm not waiting for the new high...I'm not looking for a repeat of yesterdays sell off but will think about the 97.50 area
I just exited at 95.25 as I'm not waiting for the new high...I'm not looking for a repeat of yesterdays sell off but will think about the 97.50 area
BR
BruceM
Rep: 216,211
Posts: 19,895
I'm monitoring the "window" around the key number of 1500...2.5 and 5 points above and below this number...
PT
pt_emini
Rep: 5,707
Posts: 1,940
NQ kicking into gear
Bush speaks at 1:40pm, approx 35 minutes from now
Bush speaks at 1:40pm, approx 35 minutes from now
BR
BruceM
Rep: 216,211
Posts: 19,895
thnaks for that PT....this area has the hour range projection with it too...can't see any trade though..slow grind up = danger to counter trend
DA
day trading
Rep: 39,586
Posts: 6,369
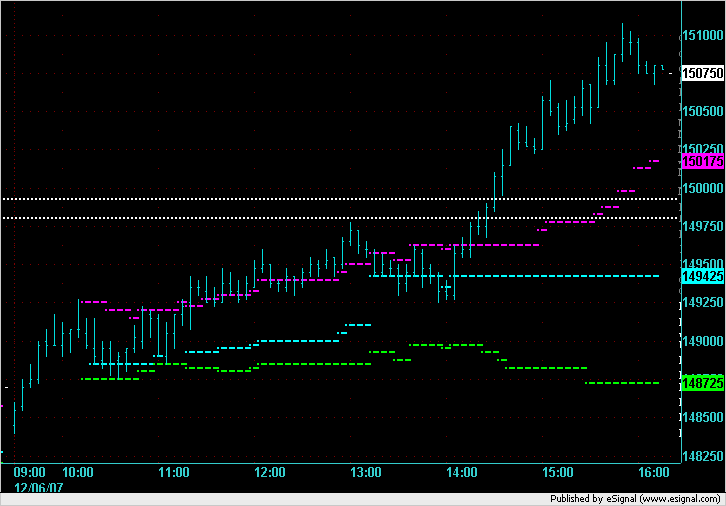
Today's action as depicted on a 5 minute chart. The chart also shows the developing value area lines and the developing POC. The 2 white dotted lines show Single Prints that formed on the chart that has not been filled. Because these Single Print are close together they may form a support area especially if this is clustered with other support lines.
Round number theory would state that 1500.00 would be natural support and with the 2 Single Prints directly below it adds some credence to this support area.
Round number theory would state that 1500.00 would be natural support and with the 2 Single Prints directly below it adds some credence to this support area.
Click image for original size