DA
day trading
Rep: 39,586
Posts: 6,369
I'm thinking that the 1469.25 price is going to be important resistance overnight tonight and tomorrow because this will be the second day that it's the VAH in the ES...
PT
pt_emini
Rep: 5,707
Posts: 1,940
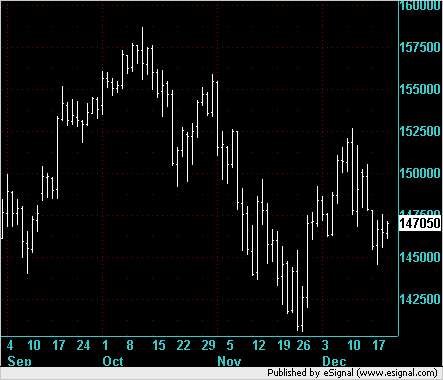
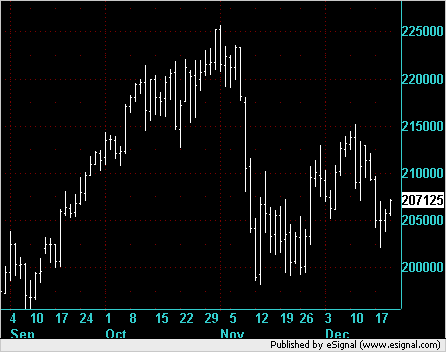
daily chart of the ES & NQ could be interpreted as a bear flag...
in which case we need to watch our support levels... yest lows obviously...
ES 1462 , 1456-58
NQ 2050, 2040
in which case we need to watch our support levels... yest lows obviously...
ES 1462 , 1456-58
NQ 2050, 2040
DA
day trading
Rep: 39,586
Posts: 6,369
These are the patterns that you're looking at right?
Click image for original size
Click image for original size
PT
pt_emini
Rep: 5,707
Posts: 1,940
yep exactly DT, given the pattern has formed inside a congestion zone (to the left), the bear flag is going to be less reliable, but something to keep in mind if sellers get hold of the market.
Bush news conference at 10am EST
Bush news conference at 10am EST
PT
pt_emini
Rep: 5,707
Posts: 1,940
A break back below ES 1471 would tend to raise suspicions on this upside gap open
PT
pt_emini
Rep: 5,707
Posts: 1,940
Double top may have formed in the NQ's
Took a short in the NQ on that last retest
NQ 2080 line in the sand for now...
Took a short in the NQ on that last retest
NQ 2080 line in the sand for now...
DA
day trading
Rep: 39,586
Posts: 6,369
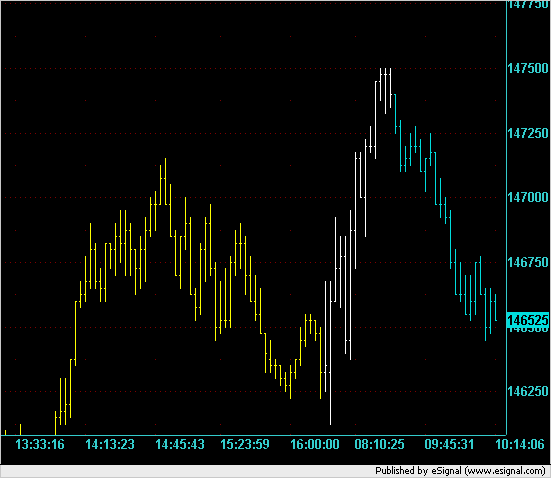
My 1469.25 resistance level was blown out the water by the overnight action. The resistance it turns out was yesterday's HOD.
Here is today's 10,000V chart with end of yesterday and overnight on it:
Here is today's 10,000V chart with end of yesterday and overnight on it:
Click image for original size
GI
gio5959
Rep: 200
Posts: 444
quote:
Originally posted by day trading
quote:
Originally posted by pt_emini
very nice charts DT, the tri-color is a nice visual enhancement, can you post one of the NQ's as well ?
I'll try and make sure that I do a 2,000V NQ and a 10,000V ES at the same time tomorrow (Friday) so we can compare side by side.
PT and DT, thank you for your information - thats what i was looking for
BTW, looking back at yesterday's NQ 2k chart i see there was a nice short 123 pattern when bruce got short.
And, at approx from 11cst to 11:54cst there was a nice long 123 pattern on the NQ 2k when i got long on the ES
Im not sure if using one index as a proxy for another is valid but i will keep an eye on that
thx again