Efficient Markets
Look at the gap on this 5 minute RTH chart of the S&P...just below 1505 at 1504.50...note the triples also....The market will find a way to "fill in" these holes in the charts.....After being "filled in" in the overnight session this same point became initial resistance in the day session the following trading day...these holes will occur sometimes in low volume trading
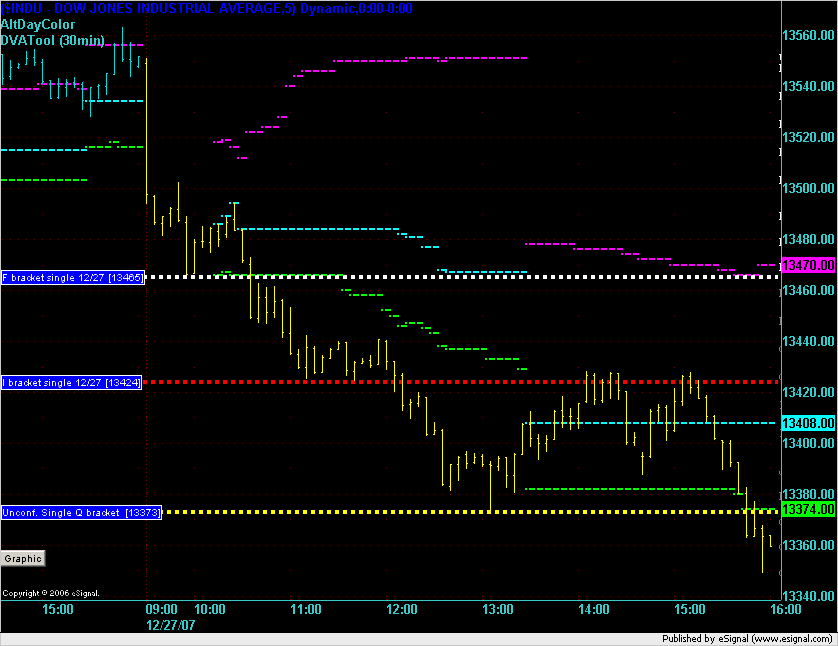
Click image for original size
Now here is one that I mentioned yesterday in the Christmas EVE thread that formed in Wednesdays trade. It happened at a price of 1501.50.....note the gap...where one 5 minute bars open and range doesn't include the close of the previous bar...
This next chart shows what just happened in the overnight.....very cool..I drew a line at the 1501.50.......
Click image for original size
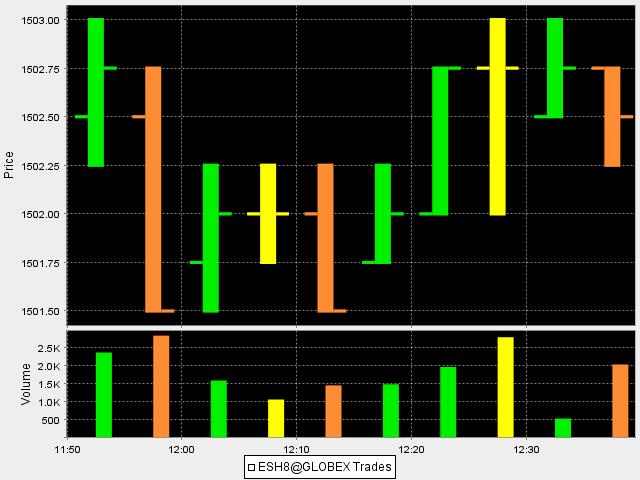
This next chart shows what just happened in the overnight.....very cool..I drew a line at the 1501.50.......
Click image for original size
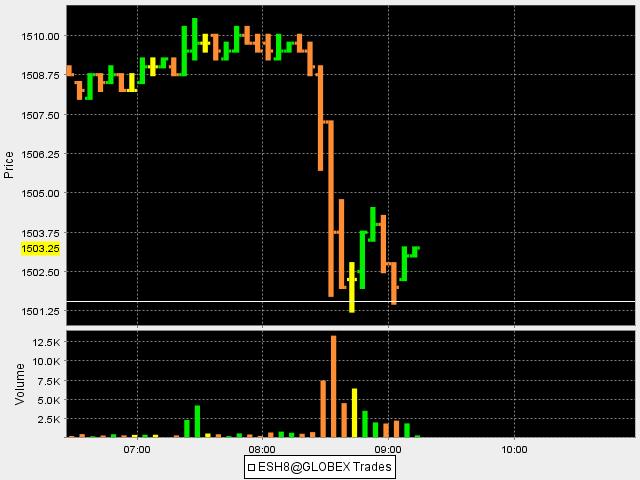
In general I find these "holes" less effective when they develop in the overnight session...the same would be true with the concept of triples...I give much more of a bias to anything that develops in the CME day session
Thats Awesome Bruce !
Here's what an 'Inverted' Dragon Pattern looks like
The head has also reached the 3DBP (3 day balance point) of 1497.75 - which is also fib 1.27 from last major pivot (the back)
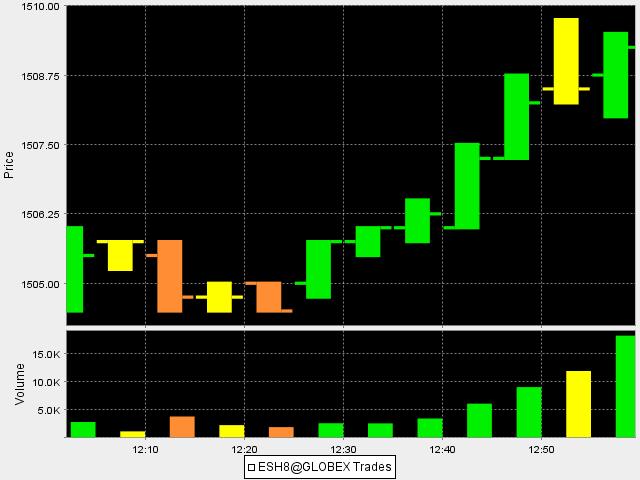
* A BruceM triple has been created at 1500.25
[file]inverted_dragon.jpg,126,,0[/file]
The head has also reached the 3DBP (3 day balance point) of 1497.75 - which is also fib 1.27 from last major pivot (the back)
* A BruceM triple has been created at 1500.25
[file]inverted_dragon.jpg,126,,0[/file]
good eyes..Gio...trying for those triples from 96.75 for the 1500 retest
this low volume is obvious high risk...and real boring!! I can barely squeeze out a point on this trade so far...but bias will remain up due to triples
I'm keeping an eye on this possible 123 pattern
might be the trigger to get us to ur triple
[file]ES_123.jpg,126,,0[/file]
might be the trigger to get us to ur triple
[file]ES_123.jpg,126,,0[/file]
i added at 96.25 to runner contracts..in a normal environment I wouldn't be as concerned but the high volume players may not come back in..98.75 is first initial target on add ons ..then the triples
I have market reversal at approx 11:15cst - maybe we get lucky and it shoots up here
Tons of volume came in at the ES 11:35cst bar - think i'll do a buy stop 1495.00
Emini Day Trading /
Daily Notes /
Forecast /
Economic Events /
Search /
Terms and Conditions /
Disclaimer /
Books /
Online Books /
Site Map /
Contact /
Privacy Policy /
Links /
About /
Day Trading Forum /
Investment Calculators /
Pivot Point Calculator /
Market Profile Generator /
Fibonacci Calculator /
Mailing List /
Advertise Here /
Articles /
Financial Terms /
Brokers /
Software /
Holidays /
Stock Split Calendar /
Mortgage Calculator /
Donate
Copyright © 2004-2023, MyPivots. All rights reserved.
Copyright © 2004-2023, MyPivots. All rights reserved.