High volume numbers
Here they are from Fridays (11-14-08) trading. Some match up with the Value area numbers. Good targets and fade points.
874 - 876 Minor volume
891 - 893.50
901- 902.50 Minor
910 - 912.50
Bruce
874 - 876 Minor volume
891 - 893.50
901- 902.50 Minor
910 - 912.50
Bruce
Bruce - have you tried using a volume @ price study which shows the volume @ price on the horizontal axis? It really illustrates your point. Thanks for sharing and welcome back. I hope your vacation went well.
I used that years ago when I had Qcharts but over time I noticed I could get better numbers by using the one minute as it shows those big thrusts.....If my memory serves me well then the V@ price can show a lot of volume just because the market traded at a particular price many times during a particular day......so it's cumulative.....
I'm really concerned with uncovering the fast big moves that often times don't get traded back to on the same day.....so Volume at price may not pick those up
As an example if we rally from a low on a big volume push and later on we spend a great deal of time consolidating at a price way above the initial rally point then V @ P will pick up the consolidation point as volume has accumulated there and will probably miss the initial thrust....
Does that make sense?
quote:
Originally posted by prestwickdrive
Bruce - have you tried using a volume @ price study which shows the volume @ price on the horizontal axis? It really illustrates your point. Thanks for sharing and welcome back. I hope your vacation went well.
quote:
Originally posted by BruceM
I used that years ago when I had Qcharts but over time I noticed I could get better numbers by using the one minute as it shows those big thrusts.....If my memory serves me well then the V@ price can show a lot of volume just because the market traded at a particular price many times during a particular day......so it's cumulative.....
I'm really concerned with uncovering the fast big moves that often times don't get traded back to on the same day.....so Volume at price may not pick those up
As an example if we rally from a low on a big volume push and later on we spend a great deal of time consolidating at a price way above the initial rally point then V @ P will pick up the consolidation point as volume has accumulated there and will probably miss the initial thrust....
Does that make sense?quote:
Originally posted by prestwickdrive
Bruce - have you tried using a volume @ price study which shows the volume @ price on the horizontal axis? It really illustrates your point. Thanks for sharing and welcome back. I hope your vacation went well.
That makes good sense. That is one reason I like to combine the VAP with the BAV study because I can see more clearly where big money rally drove the range break. Thanks.
Thank YOU Prestwick ! I appreciate the feedback. I'm hoping to get some better charts sometime soon but with my wife due in late January It will probably be a while before I can really fine tune this stuff. What I'd really like to do in the future is qualify these volume thrusts by the actually bid/ask volume and come up with some form of matrix in the hope of eliminating some of the discretion in this method.
At least it sounds like a good idea...lol..thanks again!
Bruce
At least it sounds like a good idea...lol..thanks again!
Bruce
The high Volume areas I'll be using on Wednesday will be:
832.50
839 - 841
849 - 851
862 - 864
and of course we have that 67.50
Then I'll move up to the 77 - 81....
I find that days like today are harder to determine the "good" volume areas as we consolidated so much.
We broke the hour range to the upside, then the downside and then the upside again....so finding really good volume numbers is a bit harder.
I'm hoping we break the Monday - Tuesday range to the upside this week..
Good trading
Bruce
Great work,Bruce. Very useful!
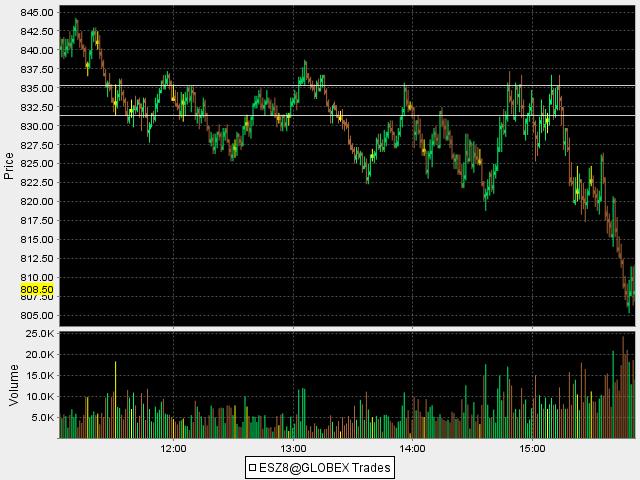
Thanks for the kind words...this morning was another classic...we rallied into the plus 8-10 number smack dab into that 62-64 zone.....so selling was the play.....then we ran down into the next key zone at 49-51.....
The market rallied again ( I sat and watched that second trade pass me by) right back up into the 62-64 number only to break once more blowing through that 49-51 on the second try....we are currently trying to bounce off the next lower zone at 39-41
This couldn't be any more clear.....here is the current chart with the zones marked
Click image for original size
what is most interesting is that many times these high volume numbers turn out to be Value area highs and lows even though I figure out the zones by the volume pushes off the one minute.......More powerful when that happens in general as more players can "see" the zones..
I also prefer zones instead of watching fixed numbers......while this thread isn't about actual entries, many times you will see price action entries off the one minute chart...I.E reversal bars, 1-2-3 etc....
I also prefer zones instead of watching fixed numbers......while this thread isn't about actual entries, many times you will see price action entries off the one minute chart...I.E reversal bars, 1-2-3 etc....
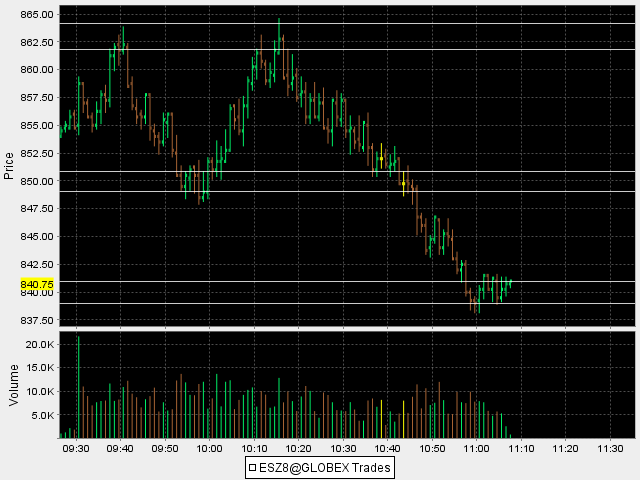
from today we have 819 - 821.50 and then 832- 835..this matches up nicely with the Va Low and POC as posted...look at that huge volume ( yellow volume bar left side of chart) spike and then see how the market reacted to it..
Interesting how the POC ends up being here too.....these two zones will be nice magnets to trade for
Interesting how the POC ends up being here too.....these two zones will be nice magnets to trade for
Click image for original size
I'd appreciate it if someone who has data on bid/ask etc could analyze the 11:30 E.S.T one minute bar and tell me if there is any information you can derive from that bar...in other words can you tell if there was heavy selling or buying etc......interesting bar as the close was at the open
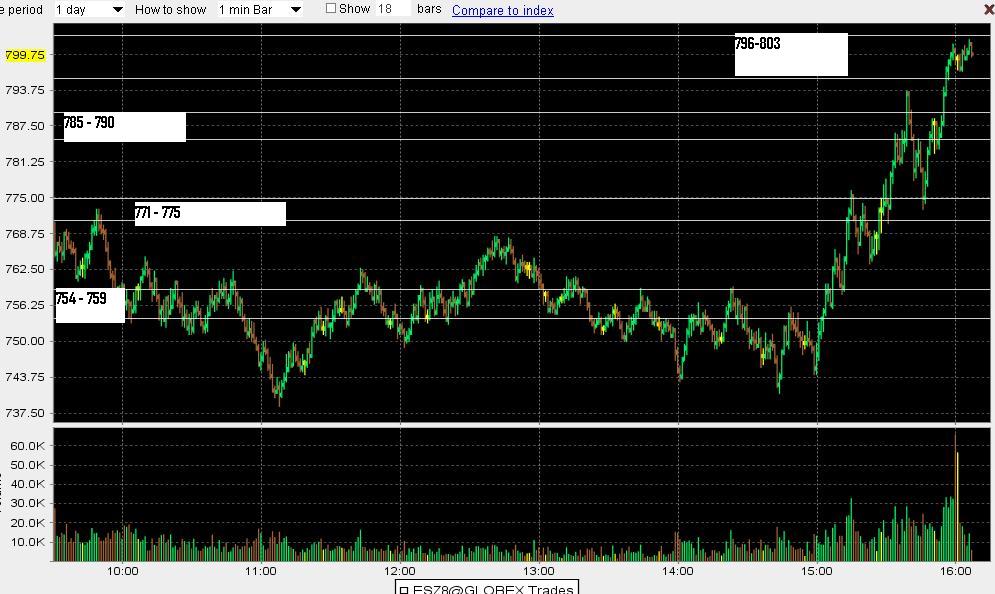
here is a fairly crude S&P chart from a few minutes ago showing the day session only.....I have the high Volume bar zones from yesterday defined on the chart. This is a one minute chart but you can see a few things:
a)How they are attractors of price
b) How they can act like support and/or resistance and reverse polarity
c) How they are not perfect by any means
The hardest part from the volume zones posted today was that we had two big zones fairly close together...the 785 - 790 area and the 796 - 803 we couldn't penetrate the 803 number and we sold off back down to 790 just before the close ( this may not be shown on my chart)
Click image for original size
Emini Day Trading /
Daily Notes /
Forecast /
Economic Events /
Search /
Terms and Conditions /
Disclaimer /
Books /
Online Books /
Site Map /
Contact /
Privacy Policy /
Links /
About /
Day Trading Forum /
Investment Calculators /
Pivot Point Calculator /
Market Profile Generator /
Fibonacci Calculator /
Mailing List /
Advertise Here /
Articles /
Financial Terms /
Brokers /
Software /
Holidays /
Stock Split Calendar /
Mortgage Calculator /
Donate
Copyright © 2004-2023, MyPivots. All rights reserved.
Copyright © 2004-2023, MyPivots. All rights reserved.