Charts 4-24-09
Click image for original size
Click image for original size
Click image for original size
Click image for original size
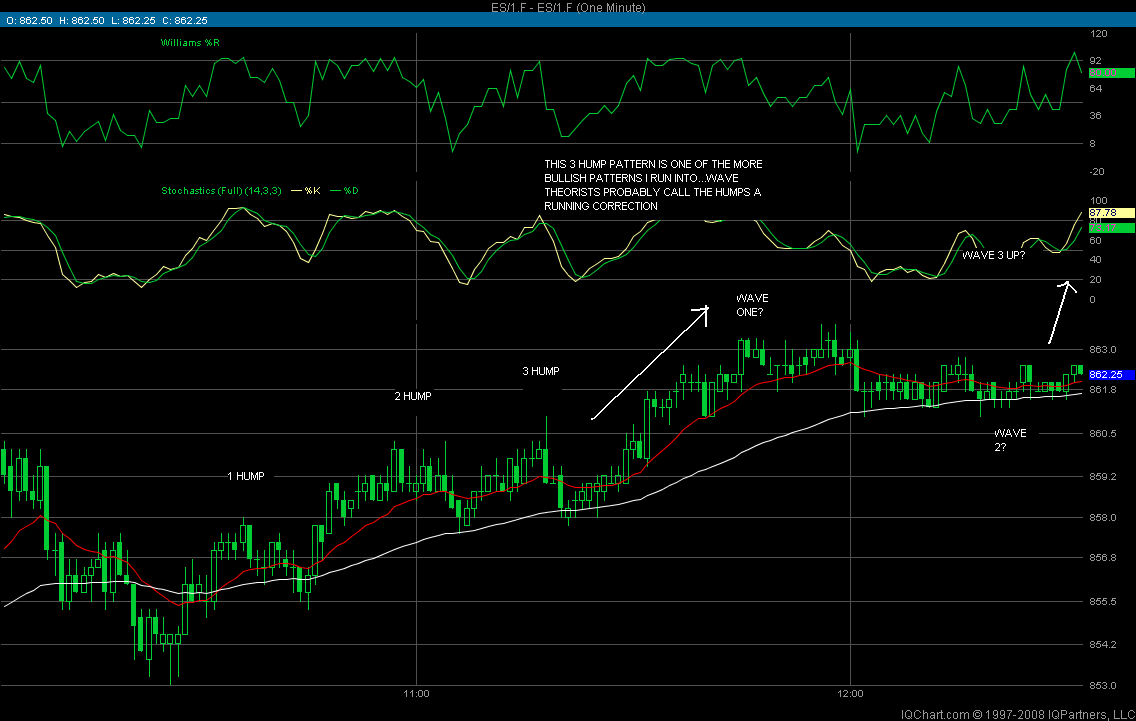
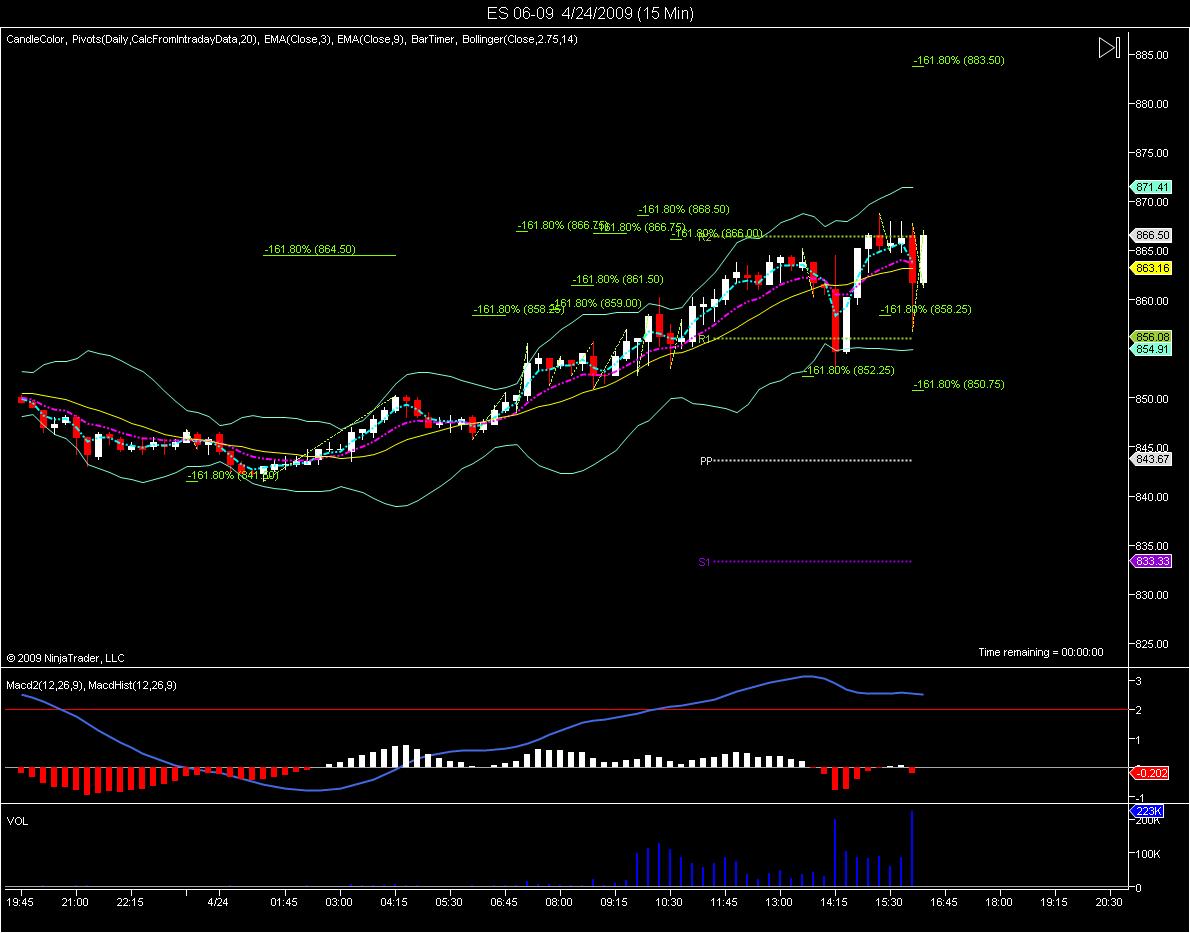
it is also called a 3 step pattern, it is prone to return to the bottom of the 1st step ,around 855, if ti makes a 4th steo it will not hold 855 on the way down,it;ll just blow right thru, the dow in 87 made this pattern right before black monday,and fell to bottom of 1st step, the nikkei made it in 90 or 91 and continued to make a 4th step and then fell and fell
Thx Iowa! all my moving averages are at 854.34 ,so i expect that to be decent support
Summary of Friday's action.
I traded poorly even though I had my projections correctly and bingo. Daughter was sick with a fever, I have to tend to her in the middle. Loss of concentration and focus.
Should not have traded. I have already sat out 3 days, should have sat out on Friday as well.
Here are the charts.
I traded poorly even though I had my projections correctly and bingo. Daughter was sick with a fever, I have to tend to her in the middle. Loss of concentration and focus.
Should not have traded. I have already sat out 3 days, should have sat out on Friday as well.
Here are the charts.
Click image for original size
Click image for original size
Hi Lordalfa,
Hope your daughter feels better.
And what is your take on the market for Monday? A lot of the charting guys (candlestick) are blogging that it will be down because of the "hanging man" pattern on the weekly charts.
Thanks,
Hope your daughter feels better.
And what is your take on the market for Monday? A lot of the charting guys (candlestick) are blogging that it will be down because of the "hanging man" pattern on the weekly charts.
Thanks,
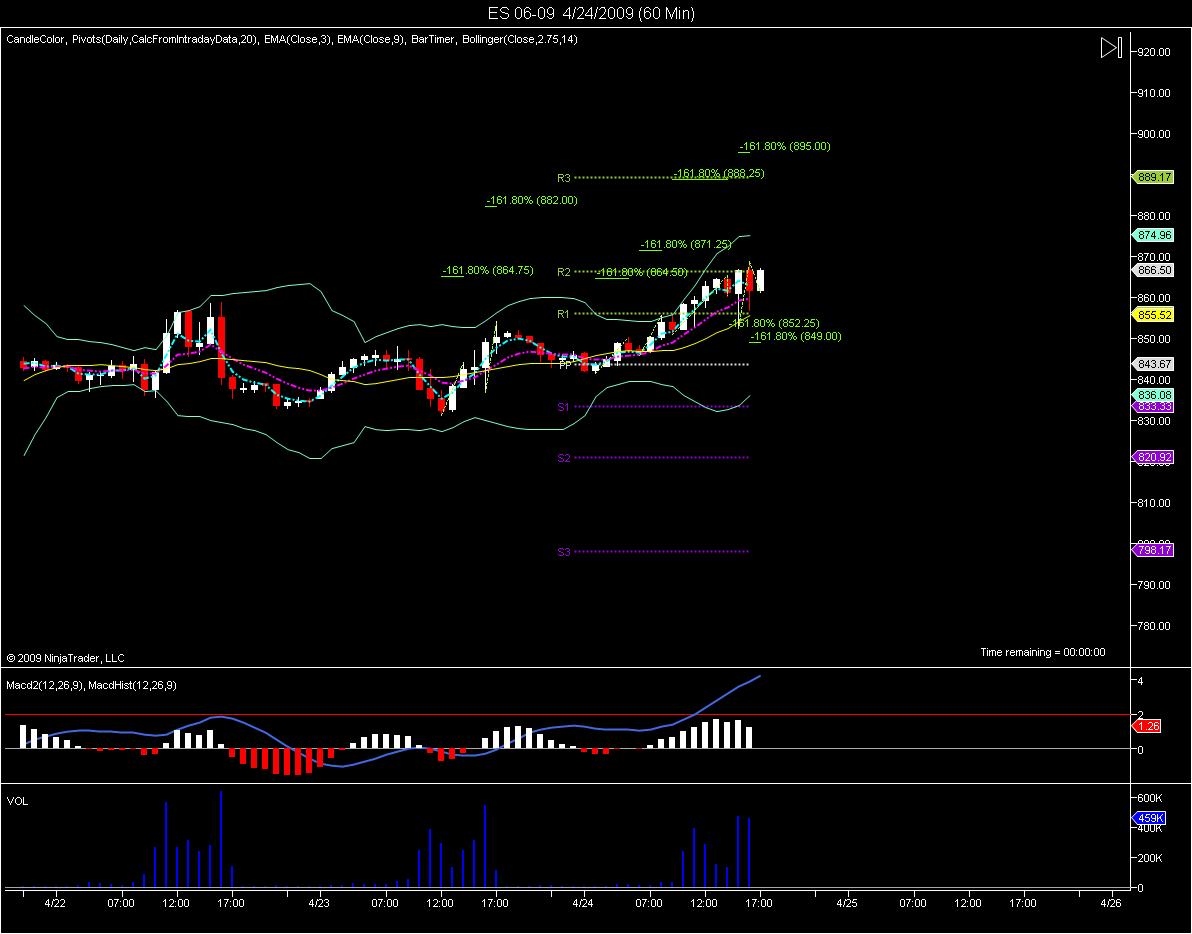
It might be true. The 60 min MACD histo is on the decline and 15 min histo is red. But I think there is a push up in Globex on Sunday evening to Monday morning before they come down ob Monday RTH.
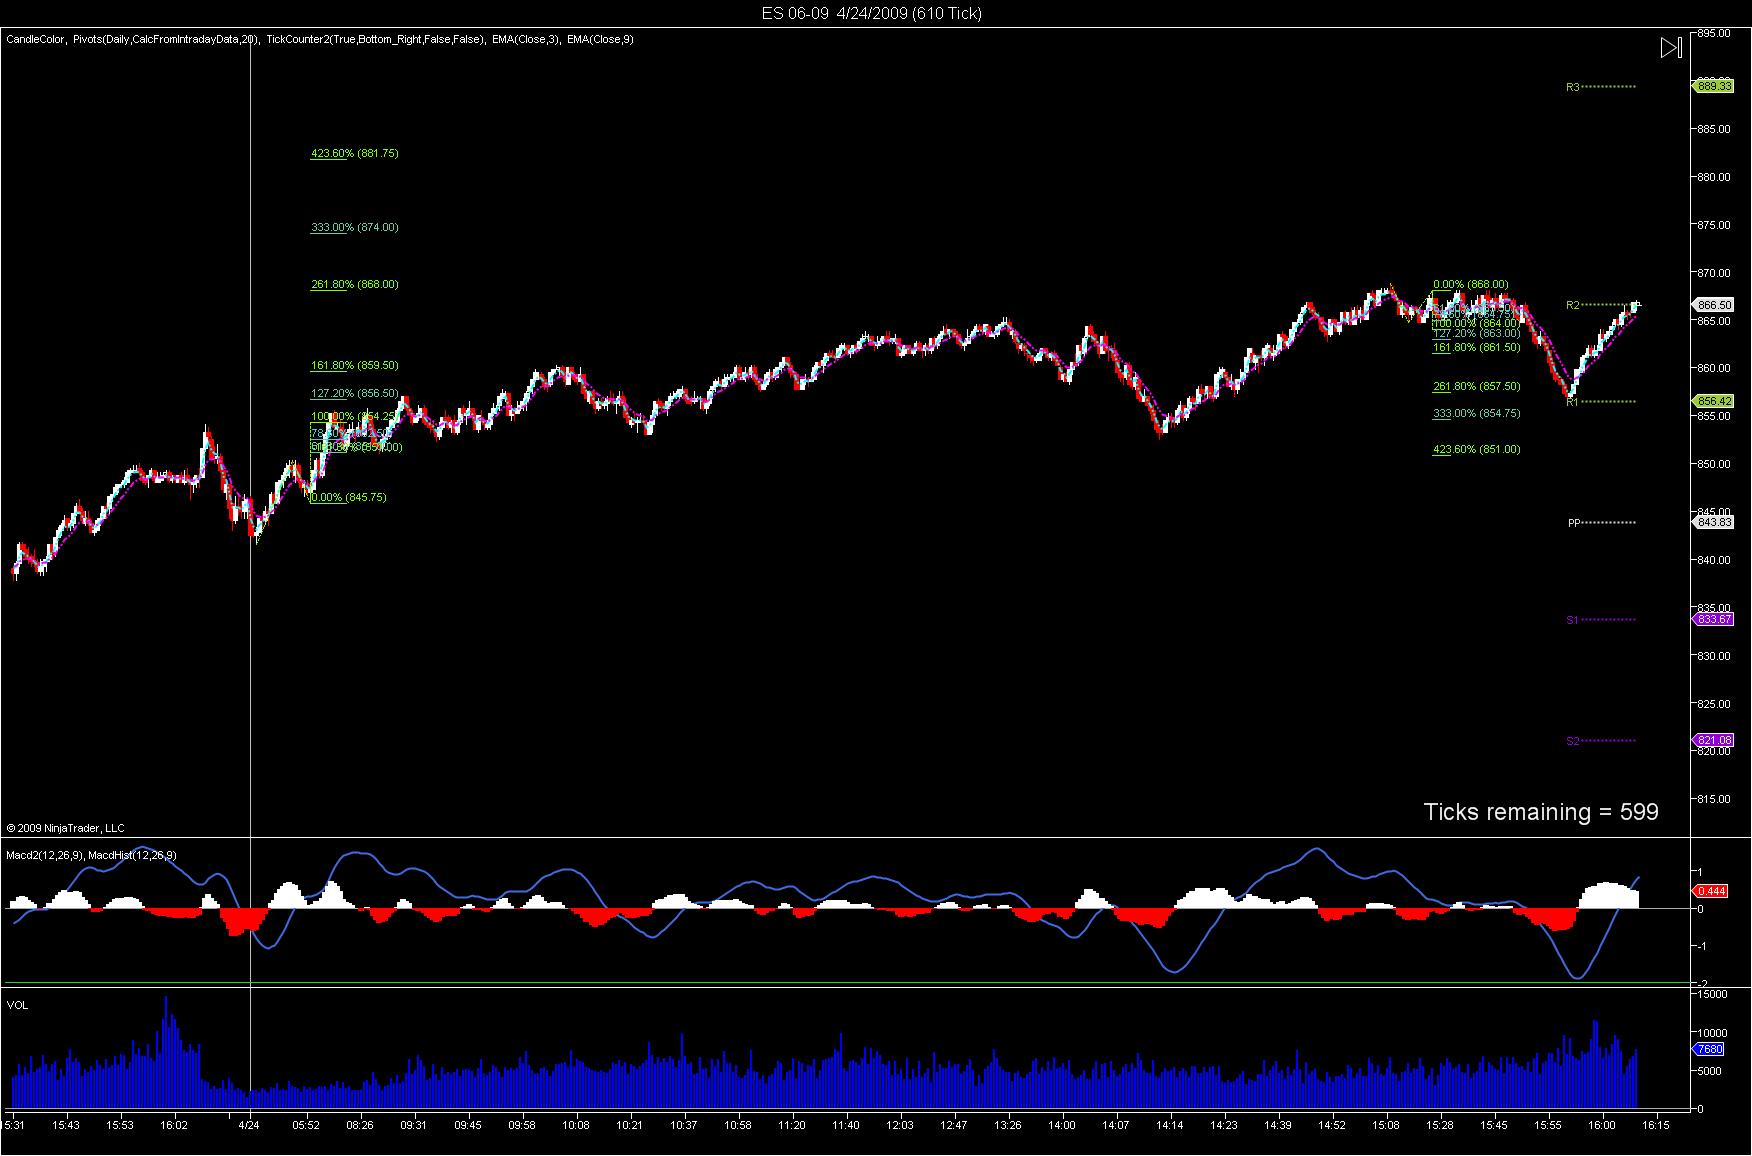
This was the close on Friday.
I took the risk of it going up while PT took it down.
Hit the 261.8% extension and returned strongly.
Watch the 261.8 in RTH, it is strong resistance/support.
This is the 610T chart. Note the 261.8% in play for the upside from the beginning of the day in Globex to the end of the day once the peak was made.
Click image for original size
Emini Day Trading /
Daily Notes /
Forecast /
Economic Events /
Search /
Terms and Conditions /
Disclaimer /
Books /
Online Books /
Site Map /
Contact /
Privacy Policy /
Links /
About /
Day Trading Forum /
Investment Calculators /
Pivot Point Calculator /
Market Profile Generator /
Fibonacci Calculator /
Mailing List /
Advertise Here /
Articles /
Financial Terms /
Brokers /
Software /
Holidays /
Stock Split Calendar /
Mortgage Calculator /
Donate
Copyright © 2004-2023, MyPivots. All rights reserved.
Copyright © 2004-2023, MyPivots. All rights reserved.