Monkey Weekend ES Analysis
Daily Chart: Midline (Andrew’s Pitchfork), black line in the area of 884 as potential RESISTANCE … potential “significant” SUPPORT at lower blue trend line in 850-852 area with the Weekly S1 Pivot at 847.25.
30 Minute Chart: Trend channel black midline at 880-882 … with the daily R1 Pivot at 882 … and a .786 fib retracement using Regular Trading Hours from 5/1 low to 4/30 high comes in at 880.50 … shows some confluence in area of 880-882 as potential RESISTANCE with the daily chart’s Andrew’s Pitchfork potential RESISTANCE just 2 points higher at 884.
13 Minute Chart: Shows price action RESISTANCE at 879.75-880.50 and then at 885. Initial price action SUPPORT at 867.50 that clusters with daily Market Profile VAL of 866.75 and weekly “average price” Floor Pivot at 867.25 and the daily S1 Pivot at 866.25 … providing a confluence/cluster of potential SUPPORT in the 866.25-867.50 zone. The next SUPPORT level below that from price action looks like 861.75-862.50.
SUMMARY: RESISTANCE @ 879.75-882 (885 as an extreme, and if penetrated and held, room to run to 900) … SUPPORT @ 866.25-867.50, and 861.75-862.50 … and 850-852 very significant.
Charts posted below.
Hey Kool, the "7 wave trend killer" ... LOL! ... (and I'm not slagging Elliott or Ellioticians) ... especially funny to me because I'd always joke about that elusive 7th wave to a friend and fellow trader with a group of us on verbal conference all day. The guy would always be counting and re-doing his count and when his 5th wave was exceeded I'd start telling him it was obviously the 7th wave and not to worry about it ... razzed him quite a bit on that one (especially when encouraging him to look out for that 7th of a 7th). And I know there are alternate counts and variations etc. that can accommodate this type of price action within EW. But over time, what I did notice is that the market would very often tend to come off a decent amount after that 4th impulse/push. Interesting!
yup, my sentiments exactly!
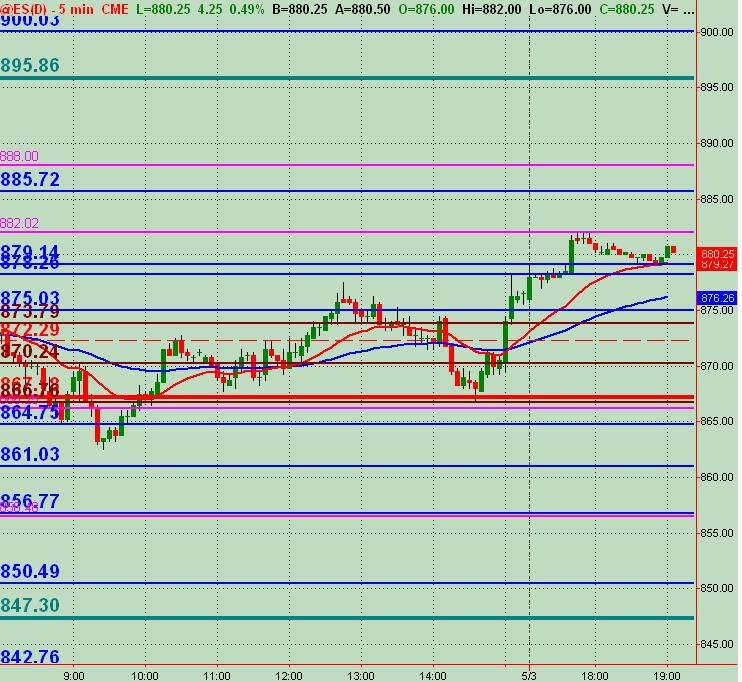
Here's the 5 minute chart I have with all of the pricel levels I want to know about. It's a total mish mash and a third person would say, "well, one of the lines will work with so many on your chart." That's not really how I'm looking at it though. I pay primary attention to the blue lines that are price action S/R levels that I've drawn in based on looking at charts in multiple time frames, from daily down to 1 minute.
There are also the DAILY and WEEKLY "floor pivot" price lines. The weekly are thick with the avg. price in red and S/R pivots in dark green. I look at the weekly ones holding more significance. The daily floor pivots of S/R are in magenta with the avg. price being a dashed red line. I'm looking at how price reacts around any confluence/cluster of the above listed price levels. Also, I've got the 3 Market Profile lines in maroon ... but I'm not an MP person of yet and look at them primarily if they coincide with a price action blue line and/or a daily/weekly floor pivot.
In other words, I end up looking for trades at key areas of confluence, but may scalp off certain of the listed price levels intraday. But in the end, my overall map and template comes from the Daily, 30 min and 13 min chart analysis ... the ones that I've posted at the beginning of this thread. I hope this makes some sense as you view the chart I'm posting below of my 5min ES.
Click image for original size
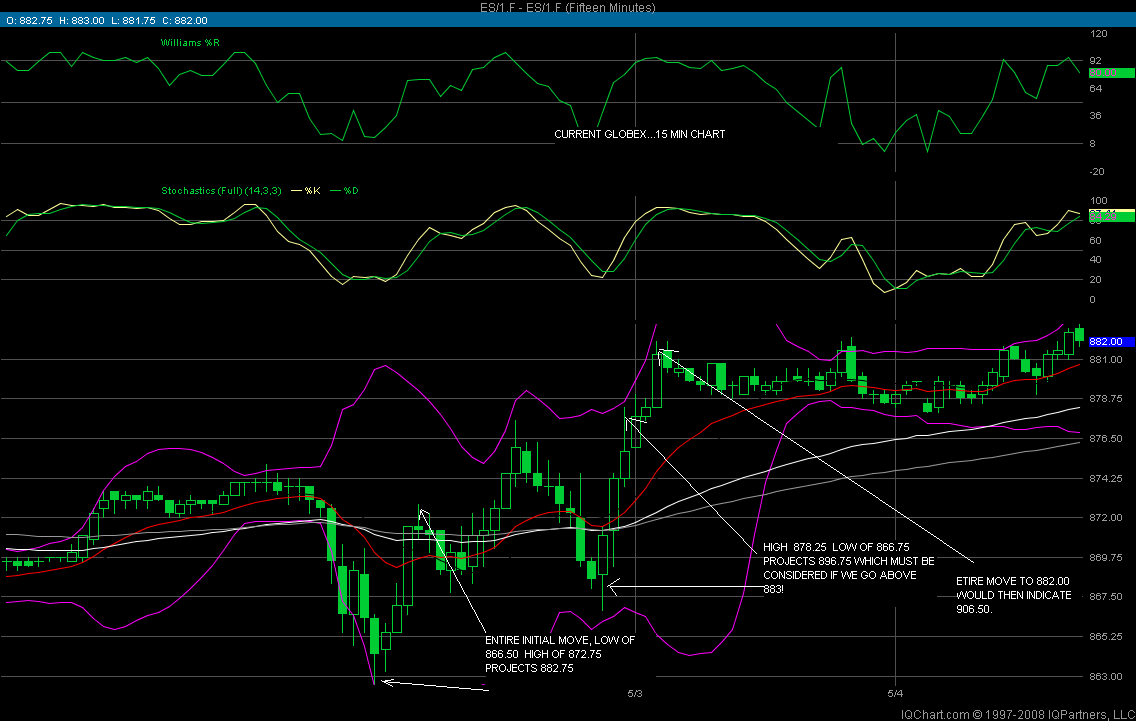
BTW ... I'm looking at price patterns too as price unfolds moment-to-moment, especially on the 5 and 1 minute charts while watching the DOM ammount bid vs. offered play out during the session. And the most important thing to me is to get some sense of whether it's an intraday trend morning or afternoon ... or likely a trading range day. If I get a sense it's a trading range, I'll fade moves into the price levels I've shown ... if it seems to be a trend, I'll likely enter into a pullback against the trend to take advantage of it's continuation. Sometimes that pullback entry is at a price level that was support and now I look at it as resistance for a short (and vice versa) ... or I'll incorporate pullbacks to intraday moving averages as points of entry. Just offering xtra info that I hope helps when you're looking at the charts I'm posting and the price levels that are of significance. It's really pretty simple to me ... or I'm simply a simpleton!
Click image for original size
Emini Day Trading /
Daily Notes /
Forecast /
Economic Events /
Search /
Terms and Conditions /
Disclaimer /
Books /
Online Books /
Site Map /
Contact /
Privacy Policy /
Links /
About /
Day Trading Forum /
Investment Calculators /
Pivot Point Calculator /
Market Profile Generator /
Fibonacci Calculator /
Mailing List /
Advertise Here /
Articles /
Financial Terms /
Brokers /
Software /
Holidays /
Stock Split Calendar /
Mortgage Calculator /
Donate
Copyright © 2004-2023, MyPivots. All rights reserved.
Copyright © 2004-2023, MyPivots. All rights reserved.