Charts 5-05-09
Click image for original size
...courtesy Francis Bussiere
Closing tick +1046
Click image for original size
Hi Kool,
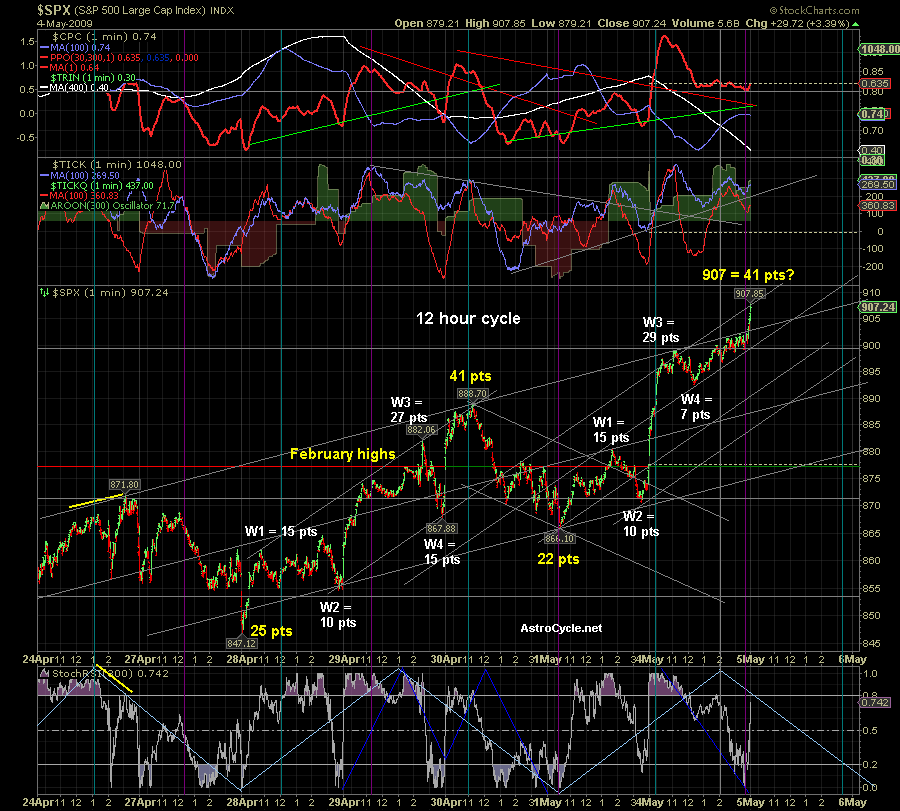
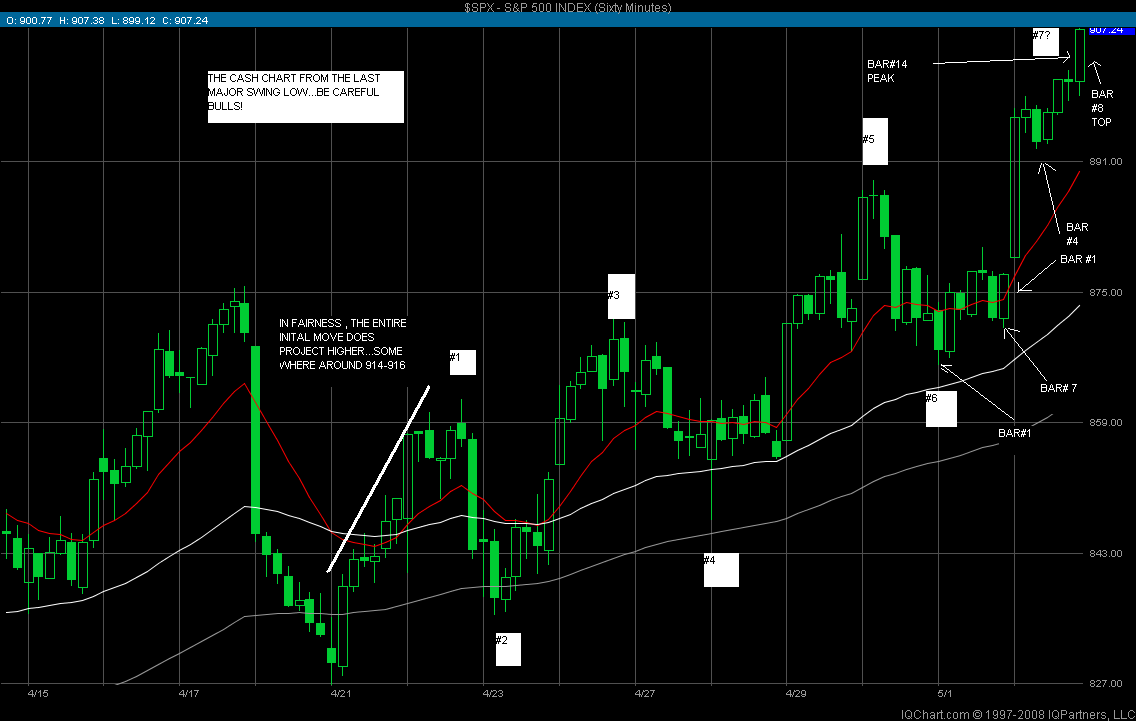
Based on the charts, do you see an imminent pull back on the S&P500? If so, how far low do you think it will go from the high of 914-916?
Thanks,
Based on the charts, do you see an imminent pull back on the S&P500? If so, how far low do you think it will go from the high of 914-916?
Thanks,
quote:
Originally posted by koolblue
Closing tick +1046
For the last 6-8 weeks it seems like a lot of the "old reliable" tools, including the TICK indicator, haven't worked as well as usual. FWIW, we have had 39 trading sessions since March 10 and closing TICKs have been above 800 for 19 of them (50%) and above 1000 for 15 of them. Since March 10 we have had only 3 multi-day retraces of 40 or more points (excluding Globex).
Just an observation - not a criticism. Plus, over time things tend to revert to their mean.
Click image for original size
quote:
Originally posted by shopsmart
Hi Kool,
Based on the charts, do you see an imminent pull back on the S&P500? If so, how far low do you think it will go from the high of 914-916?
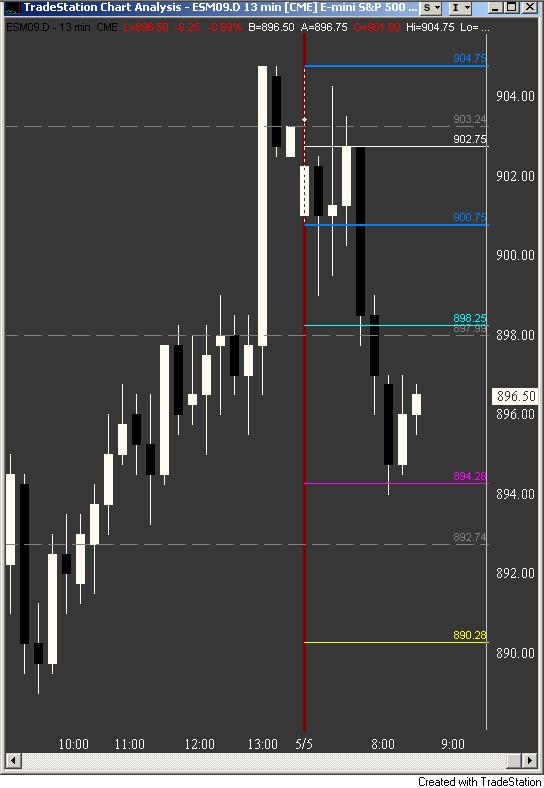
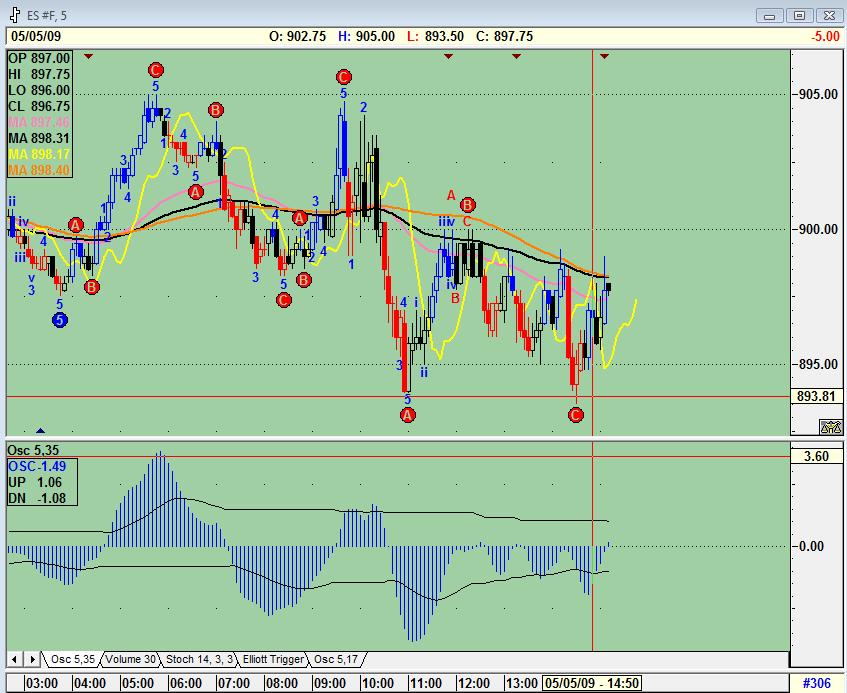
Thanks, well, my point in the charts was to indicate how the pit open has to decline (before higher prices that may be seen later)
Click image for original size
Click image for original size

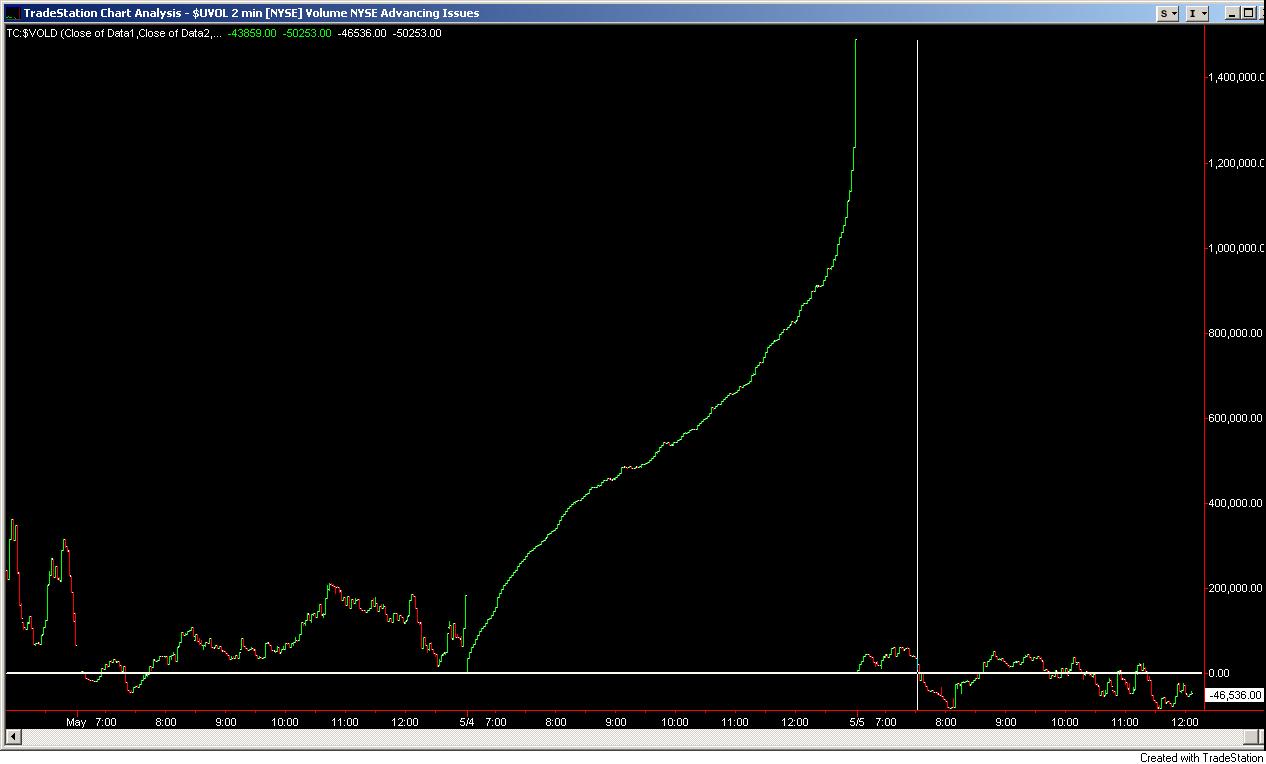
TC$VOLD indicator, today it just going back and forth along th zero, however, yesterday looks like a shuttle launch and you would never find anywhere to short.
Click image for original size
Click image for original size
Click image for original size
Emini Day Trading /
Daily Notes /
Forecast /
Economic Events /
Search /
Terms and Conditions /
Disclaimer /
Books /
Online Books /
Site Map /
Contact /
Privacy Policy /
Links /
About /
Day Trading Forum /
Investment Calculators /
Pivot Point Calculator /
Market Profile Generator /
Fibonacci Calculator /
Mailing List /
Advertise Here /
Articles /
Financial Terms /
Brokers /
Software /
Holidays /
Stock Split Calendar /
Mortgage Calculator /
Donate
Copyright © 2004-2023, MyPivots. All rights reserved.
Copyright © 2004-2023, MyPivots. All rights reserved.