Monkey Wkend ES Analysis
These are the ES charts I'm looking at as a template/map coming into the week. The daily has a "T" drawn on it as well as a parallel trend channel, with midline (blue). Also, the 200 sma and other listed price action levels of S/R are aligning/collecting in a somewhat "tight" area as potential resistance.
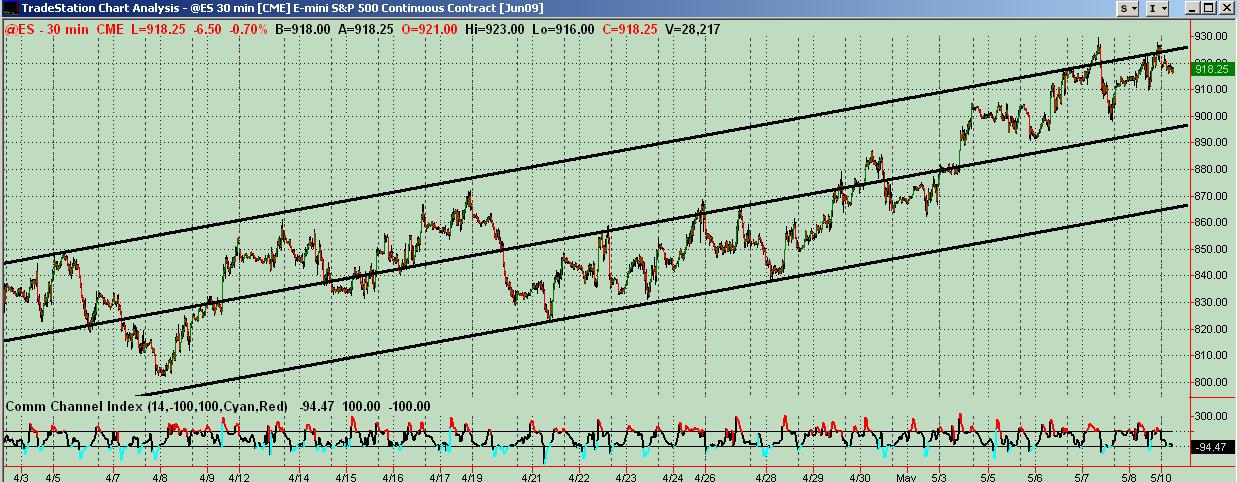
The 30m chart has pushed slightly above the trend channel a couple of times but am still keeping the channel intact where it is for now. It's "described/contained" price extremely well for over 2 weeks now, and may well offer price levels for "reaction" still.
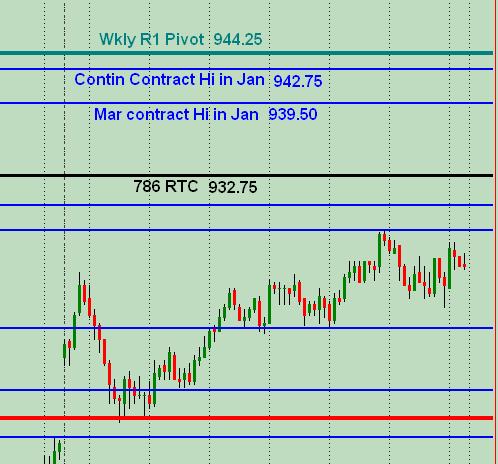
5m RTH chart is labeled with some of the same levels and other potential resistance prices listed above the current market.
927.75-930 area significant potential resistance ... with 939.50 being the March contract high in January as next significant level.
Seeing initial price action support at 918.50 and then 912.75.
Any MP/fib/floor-pivot levels at these prices would only add to their significance ... in addition to the price channel levels on the 30m and daily charts as they unfold in real time.
Open to feedback, and other analysis !!!
The 30m chart has pushed slightly above the trend channel a couple of times but am still keeping the channel intact where it is for now. It's "described/contained" price extremely well for over 2 weeks now, and may well offer price levels for "reaction" still.
5m RTH chart is labeled with some of the same levels and other potential resistance prices listed above the current market.
927.75-930 area significant potential resistance ... with 939.50 being the March contract high in January as next significant level.
Seeing initial price action support at 918.50 and then 912.75.
Any MP/fib/floor-pivot levels at these prices would only add to their significance ... in addition to the price channel levels on the 30m and daily charts as they unfold in real time.
Open to feedback, and other analysis !!!

Additional observations: Friday was an Inside Day using 24 hour data on the ES ... and only a tick above Thursday's high using RTH. Still in an intermediate uptrend on the daily chart with most sell offs intraday being overwhelmed by buying, pushing price back up to where most days during the past few weeks have closed above their open.
Click image for original size

FWIW...i called for strong support at 910.75 last nite at the globex open...so far so good!
Good call on the 910.75 ... offered several decent overnight scalps! I ended up playing the NQ off of the ES/Dow price action after the RTH open move down (looking for a long) and fired at 1370.00 NQ just as it broke to the upside and so I missed it, literally by seconds ... didn't want to chase. Since the NQ had been stronger pre mkt and also coming into the open ... was a great opportunity missed. I did scalp 3 trades on the way up, but wished I'd had it long at the initial price which I would have gotten more points out of since it trended so well (no reason to exit). After that, I shut it down because I didn't have a grasp of what was going on with the ES ("feel") at that point or overall mkt. Any chart from the 5 down to 1 minute was painfully obvious that NQ had "juice" behind any move to the upside if ES/Dow bounced. Bleh!
Ummm ... as if everybody and their dog's uncle isn't aware of this formation on the daily ES 24 hour data chart. Have an Inside Day of and Inside Day with a Wedge pattern. The most current bar has broken out to the downside of the wedge as of this post (8:15 Eastern Time) in overnight trading so far.
More roadmap to look at while drilling down into intraday trading.
More roadmap to look at while drilling down into intraday trading.
Click image for original size
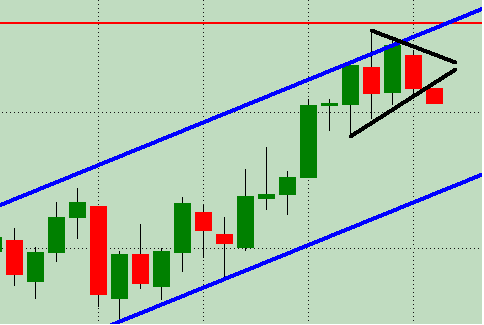
I am long but excited about this pattern, I think its going to be a bear trap...Only problem for the ES shorts is oil is about a few ticks from breaking UP out of its 3day range which would put the squeeze on ES shorts. Of course I am in love with the upside right now and am biased, But I have noticed before that when only the overnighters can push the market in the opposite position as the day time traders it usually gets a lift right back where it was unless its news related. I can't believe I missed this great short, I had all kinds of indicators telling me to short, thats what happens when you get biased...that means I need a break, when I start missing it like this
i waited all freakin day mon for 904 the 15 min deadly projection and it was never hit . Fially they hit it in globex right as i have to leave for work!,... jerks! sigh!
Two thumbs up and a doggie biscuit for a good day in the mkt Joe! Yeah, I trade the NQ's some based off of ES action intraday primarily looking at relative strength/weakness and price reaction areas, for example, where the ES is beginning to bounce usu. off an area of prior price action support and/or a pivot etc. and often get a decent magnitude bounce on the NQ. [dang that was a long sentence] The reverse for shorts. Thurs and Fri the NQ was weaker than ES, espec. in first hour or two. As ES would resume its downmove I'd hit the NQ short for usu. a scalp. I'm using 5min down to 1min charts when looking at the intraday comparisons for relative strength trades. I think it was Monday where the NQ was stronger and holding up better which offered some good buy/scalp opportunities (if memory serves) on ES bounces etc. Btw, thanks for those sq 9 numbers for today!
Regarding the Magic T ... I stumbled across info on it in the ninties (written up by Terry I think) and got somewhat familiar with it at the time, but not in depth. It was basically about symmetry and, in effect, was about price and time it seemed. At least that's what I recall even though I'm sure there's more detail to it. When a chart starts to look like the one above, you can't help but put a "T" on it for reference. Have had that on the chart for roughly 3 weeks now. Now you've got me interested in revisiting it for more detail.
Regarding the Magic T ... I stumbled across info on it in the ninties (written up by Terry I think) and got somewhat familiar with it at the time, but not in depth. It was basically about symmetry and, in effect, was about price and time it seemed. At least that's what I recall even though I'm sure there's more detail to it. When a chart starts to look like the one above, you can't help but put a "T" on it for reference. Have had that on the chart for roughly 3 weeks now. Now you've got me interested in revisiting it for more detail.
Emini Day Trading /
Daily Notes /
Forecast /
Economic Events /
Search /
Terms and Conditions /
Disclaimer /
Books /
Online Books /
Site Map /
Contact /
Privacy Policy /
Links /
About /
Day Trading Forum /
Investment Calculators /
Pivot Point Calculator /
Market Profile Generator /
Fibonacci Calculator /
Mailing List /
Advertise Here /
Articles /
Financial Terms /
Brokers /
Software /
Holidays /
Stock Split Calendar /
Mortgage Calculator /
Donate
Copyright © 2004-2023, MyPivots. All rights reserved.
Copyright © 2004-2023, MyPivots. All rights reserved.