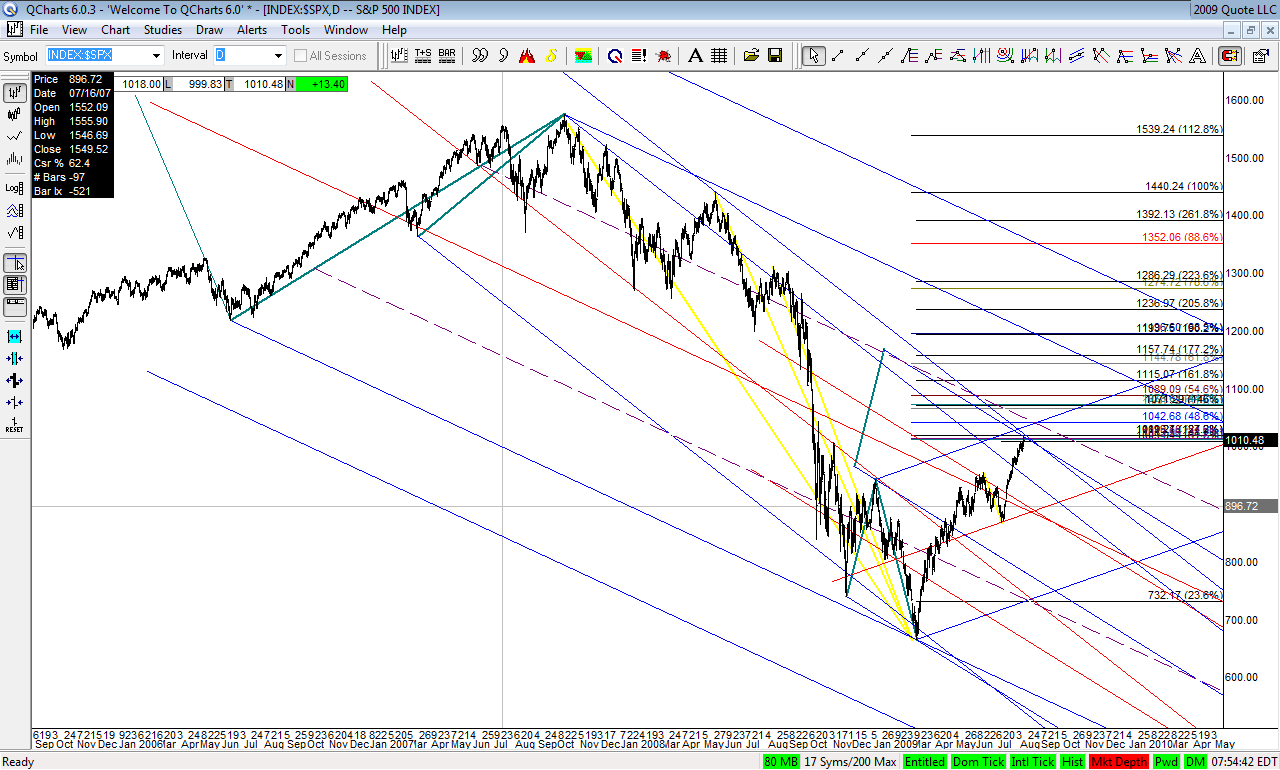
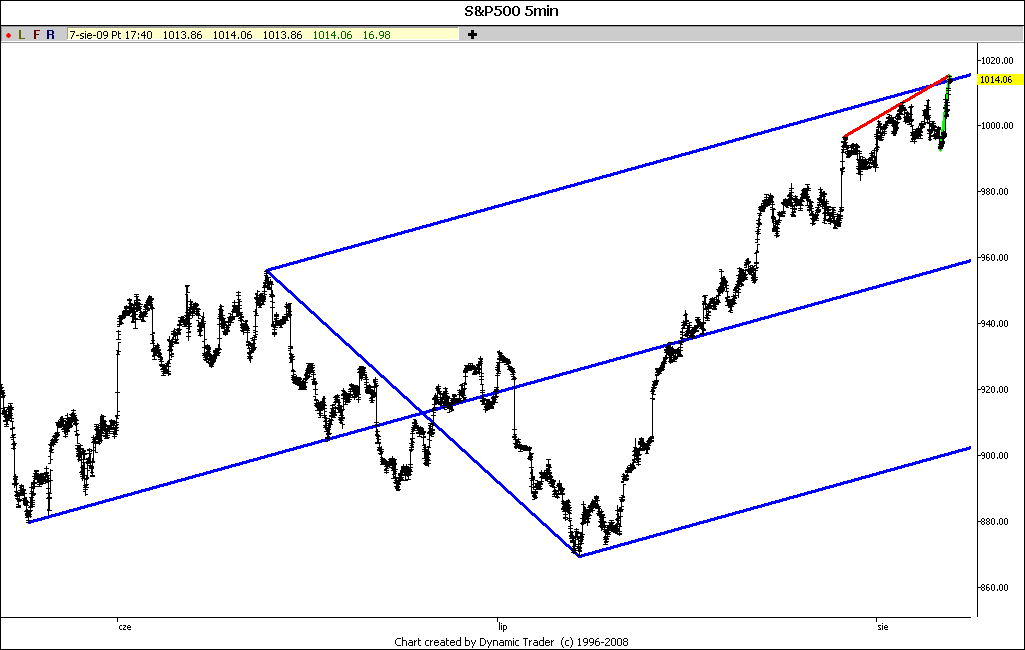
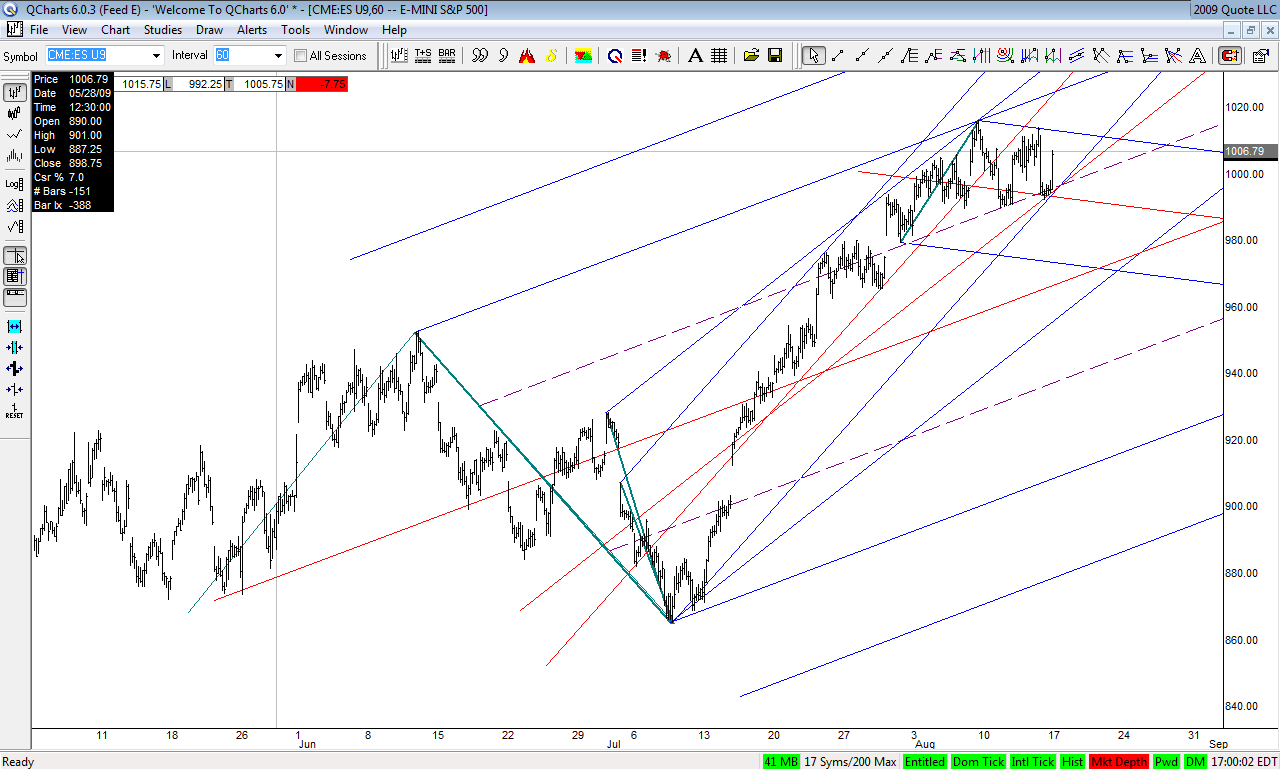
Okay, M, >>>it's there<<<<. Complete with straight up blow off 'wave 5'. You think it will turn down now?
sure it will turn down....a few points for a sec :)
M,
Don't be so sure, this one might produce more of a reaction. But who cares, my plan is the same as it has been, and I made it clear awhile back. Long, long, long on every pullback setup, and take a short shot at every key area as it rises. We just hit a key area. Whatever happens, happens. But every time it hits one of those areas and produces a trigger, I plan to act on it. Intraday on the ES with a fine trigger, and with SPY puts with an appropriate trigger for that timeframe, that's my preferred manner of play. Then just let it play out.
BTW, can you post an updated chart on this?
Now holding on tight to those early SPY puts...ES 1015 is my entry level. Hey what are the odds of this one working out like the trade from 666? I can see a retest of the area may occur, but, would they let the bulls have their chance to ride back up and lock in max gains at their second chance? I doubt it...those hoping for more than that without an optimum entry and stops in place are just asking for trouble I think.
Jim that first bear 4PC after friday's HOD on the 89tick chart was a real beauty.It solidified my positions off my early trigger and enabled me to reduce my risk to breakeven on the SPY puts trade , by riding the futures into the close for a decent gain that sufficiently cover a stop out hit on the options.
That afternoon sell might be just some people looking to go flat over the weekend. well,I don't know but that's how they apparently seem to paint it.Whatever...
Also note the action along the support upsloping TL from the globex morning pre-open low(8:30am) into lunch time. The last leg had line creep written all over.It didn't break in an obvious manner but rather moved through it laterally and then later broke down. This was in conjonction with other price action factors as well,gap open, 5 waves price expansion, 1.618 DBS,Spike line,etc...a LOT of things coming into the PTA.
The .382 grouping has been reached and reacted off of. However the .382 fib itself on my chart didn't get hit.I leaned on an "almost' hit scenario for my coming into action because, from my reasoning , if they actually go to the significant .382 level they would have to compete with a crowd with size to get in position.It's way better to sell into strength while there are still some late chasing bidders than trying to sell big chunks with everybody else trying to beat you to the punch by stepping in front of your orders, no?
Anyways, enjoy your weekend all!
T
Hi Tony, Jim
I'm beginning to learn about options, and have never traded an option contract.
Could you tell me for education purposes, the spy put strike price you bought, (the expiration date), and at what premium ?
How will you manage this put option ?
When will you move your stop ? Do you use a stop order in case you bought a put option (since your risk is limited to the premium) ?
Want to learn the parameters you guys look at when choosing the option to trade.
I'm looking to use "longer term" spy put options to trade the coming downleg (if triggered).(long put)
Timezone March-April 2010. Any ideas about the parameters I should look at when choosing a put option for this strategy ?
Hey, M, did you use the same chart labeling as the previous chart? It looks like it replaced your last chart out with this one (look at the chart date on the post from 8/4). That's too bad, because you made some changes, and we want to see where it was and where it is now. Do you still have that chart? It looks to be overwritten in the chart file itself (because you used the same name). If you can edit that post and reload the old chart that would be great. if not, and you still have the old chart, send it to me and I'll edit it. Thanks.
Interesting. I wasn't aware that using the same name would also change the previously posted chart. I don't have it anymore. I overwrote it.