JA
jarek
Rep: 94
Posts: 3,474
Since not everybody here might be interested in such "exotic" market as Warsaw Stock Exchange I decided to start a seperate topic on it outside the regular trading discussions.
JA
jarek
Rep: 94
Posts: 3,474
Here is the chart updated as of yesterday's close:
It sure reacted nicely of that 4PT but now a downside acceleration would be needed if its W3 from the top indeed. This wouldn't be possible without US markets "contributing" and Jim sees a potential reversal there.
Now let's see which market will take over the control :-)
Click image for original size
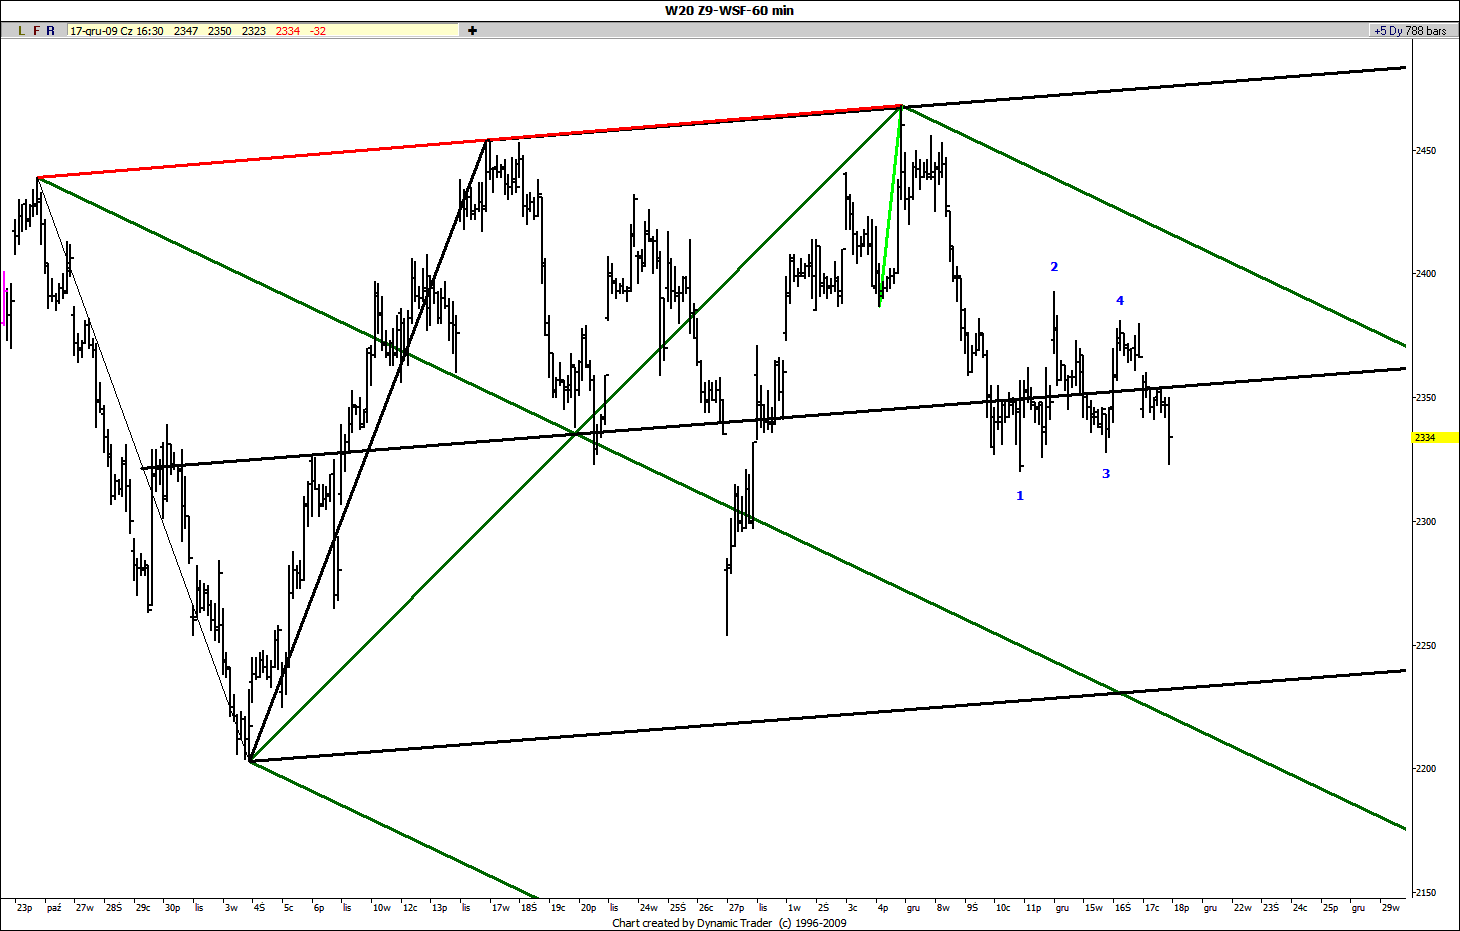
It sure reacted nicely of that 4PT but now a downside acceleration would be needed if its W3 from the top indeed. This wouldn't be possible without US markets "contributing" and Jim sees a potential reversal there.
Now let's see which market will take over the control :-)
JA
jarek
Rep: 94
Posts: 3,474
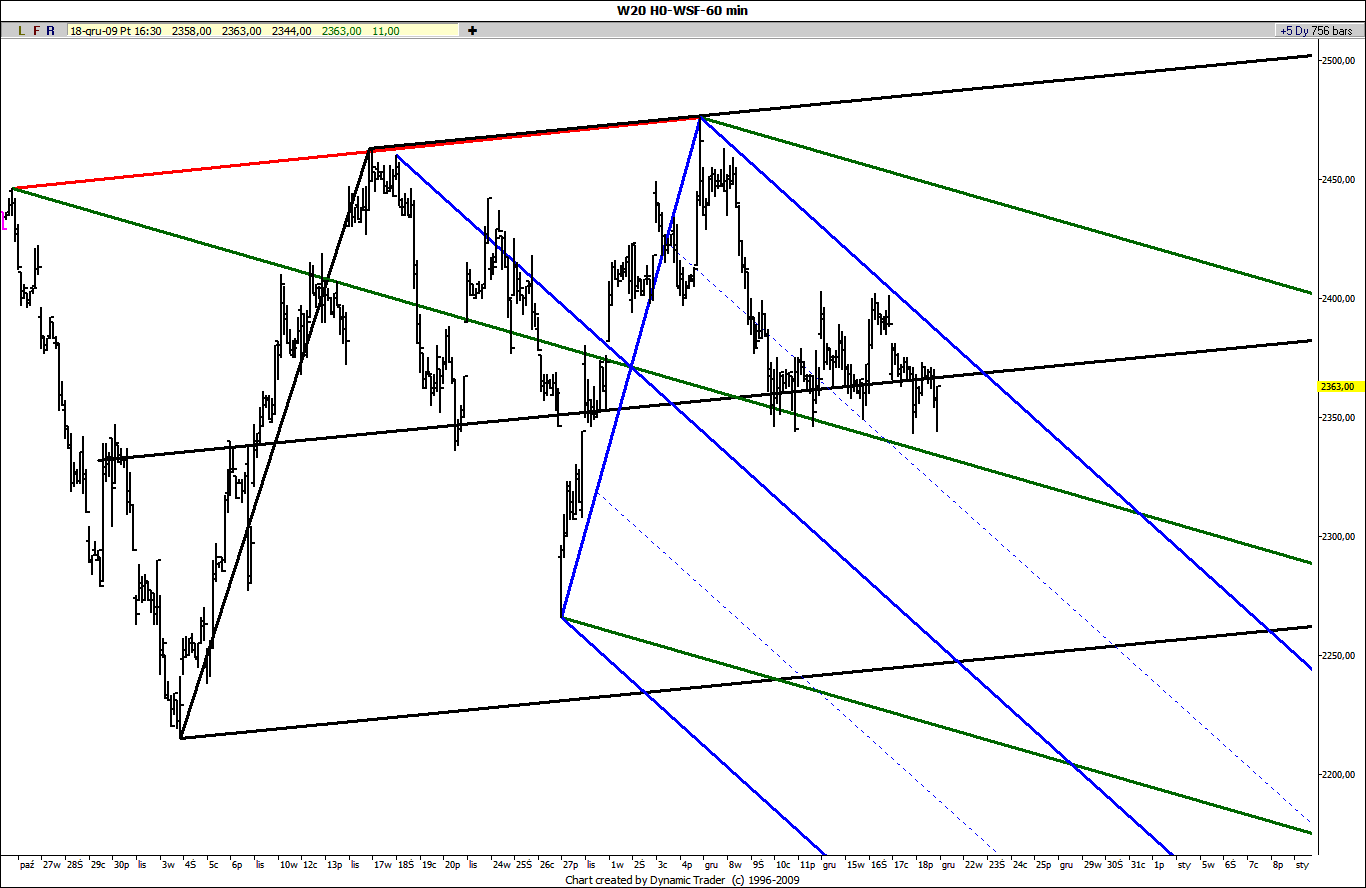
I updated the chart with the new futures series, as the old one is already gone. The Kane 4PT which looked and worked so perfectly well on the old series now looks more like a Flat ABCD.
I exchanged my previous Roofer's The Trade set with a flatter one where the price target was already hit with a first thrust down.
I also added new ML set which represents well recent price action:
I exchanged my previous Roofer's The Trade set with a flatter one where the price target was already hit with a first thrust down.
I also added new ML set which represents well recent price action:
Click image for original size
JA
jarek
Rep: 94
Posts: 3,474
Here is the update of my chart for Warsaw Stock Exchange posted in the main thread on Sunday:
As expected we reached the ML of Roofer's The Trade set (although a day later than I anticipated)
Click image for original size
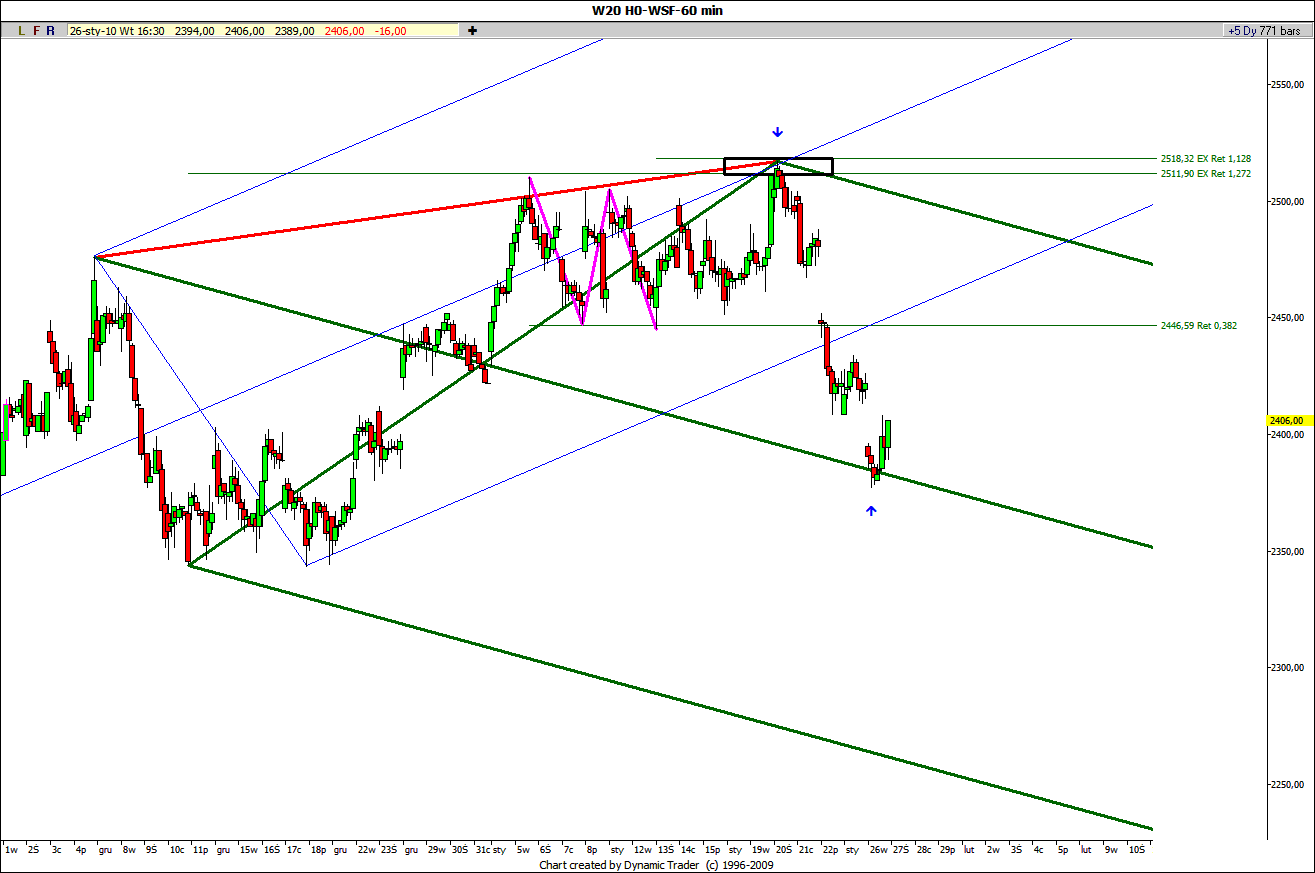
As expected we reached the ML of Roofer's The Trade set (although a day later than I anticipated)
JA
jarek
Rep: 94
Posts: 3,474
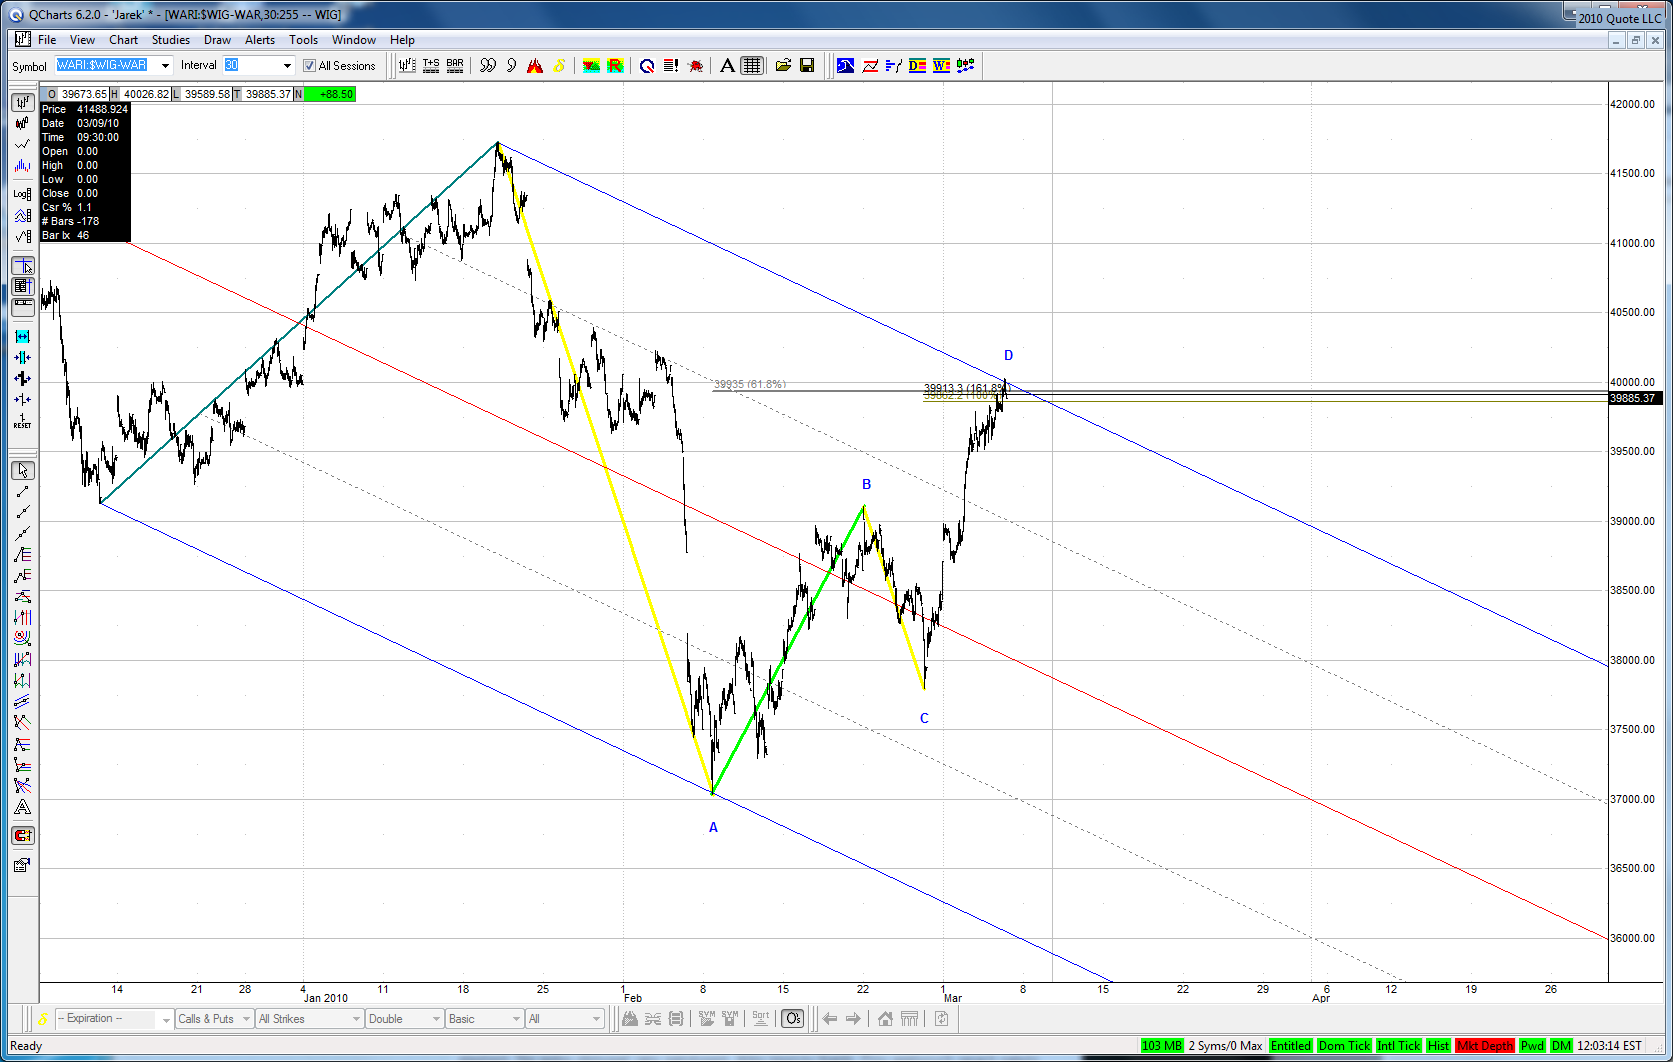
Major Polish indexes finished the day in a very important spot, both forming almost ideal trend continuation ABCDs:
Failure to rise above today's highs should mean a drop to new lows of the move from January's high. Such potential new lows wouldn't be possible without major world indexes contributing to the downside.
On the other hand a break of such clear ABCDs will show the strength of the current bounce.
Click image for original size
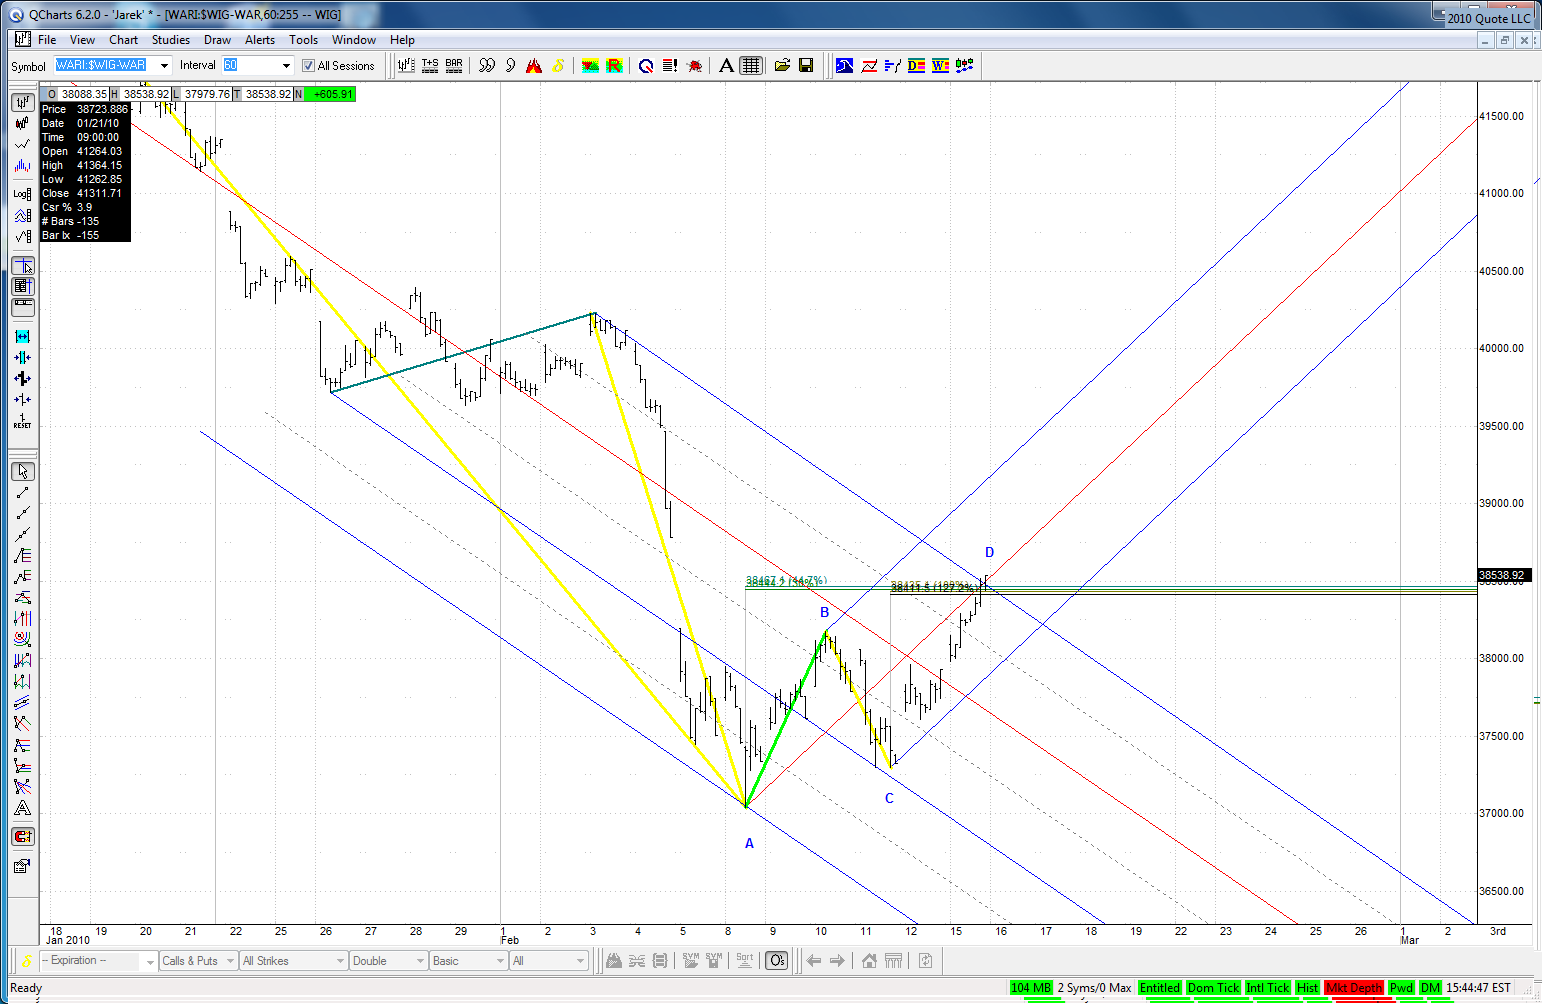
Click image for original size
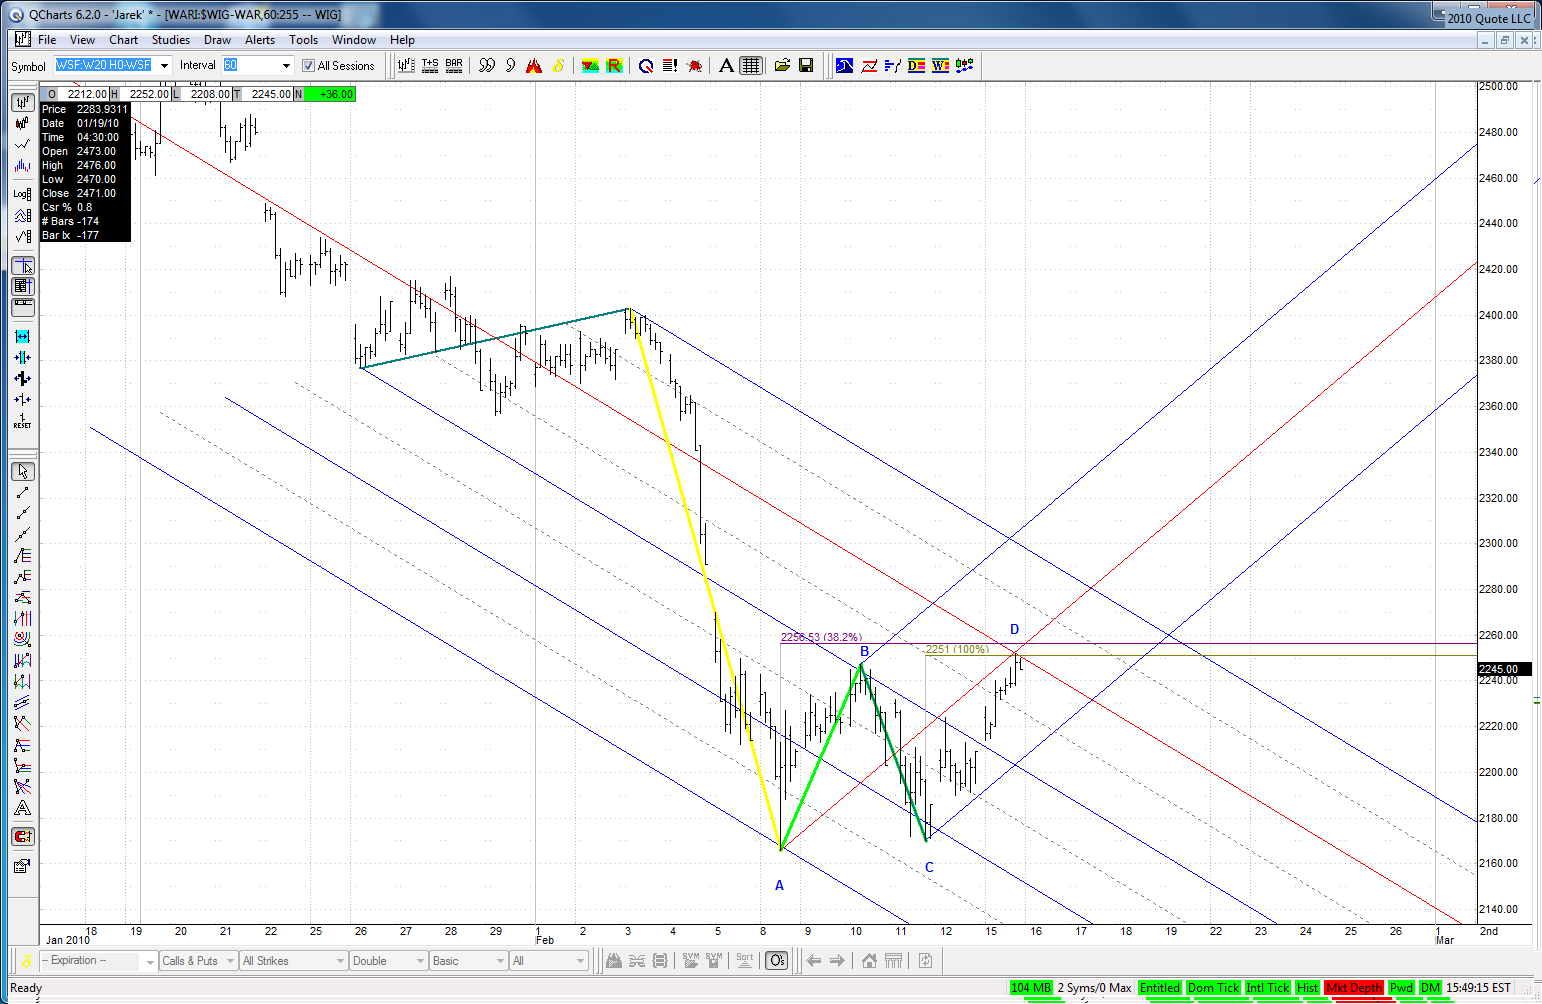
Failure to rise above today's highs should mean a drop to new lows of the move from January's high. Such potential new lows wouldn't be possible without major world indexes contributing to the downside.
On the other hand a break of such clear ABCDs will show the strength of the current bounce.
JA
jarek
Rep: 94
Posts: 3,474
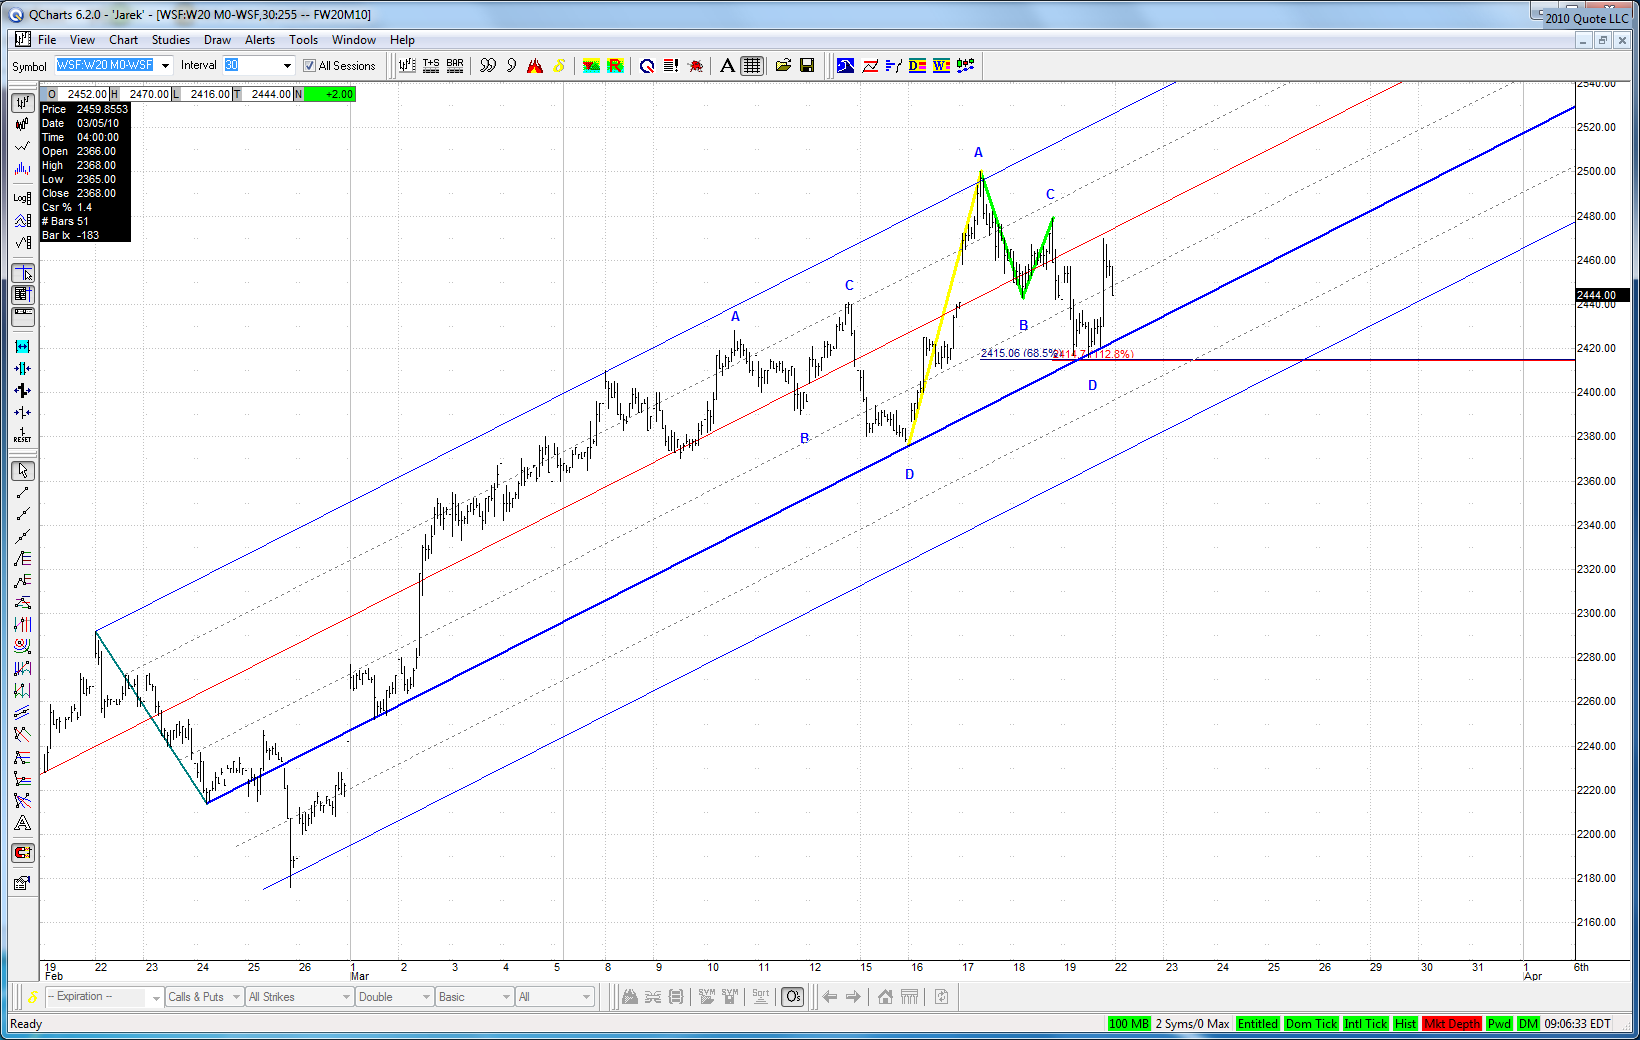
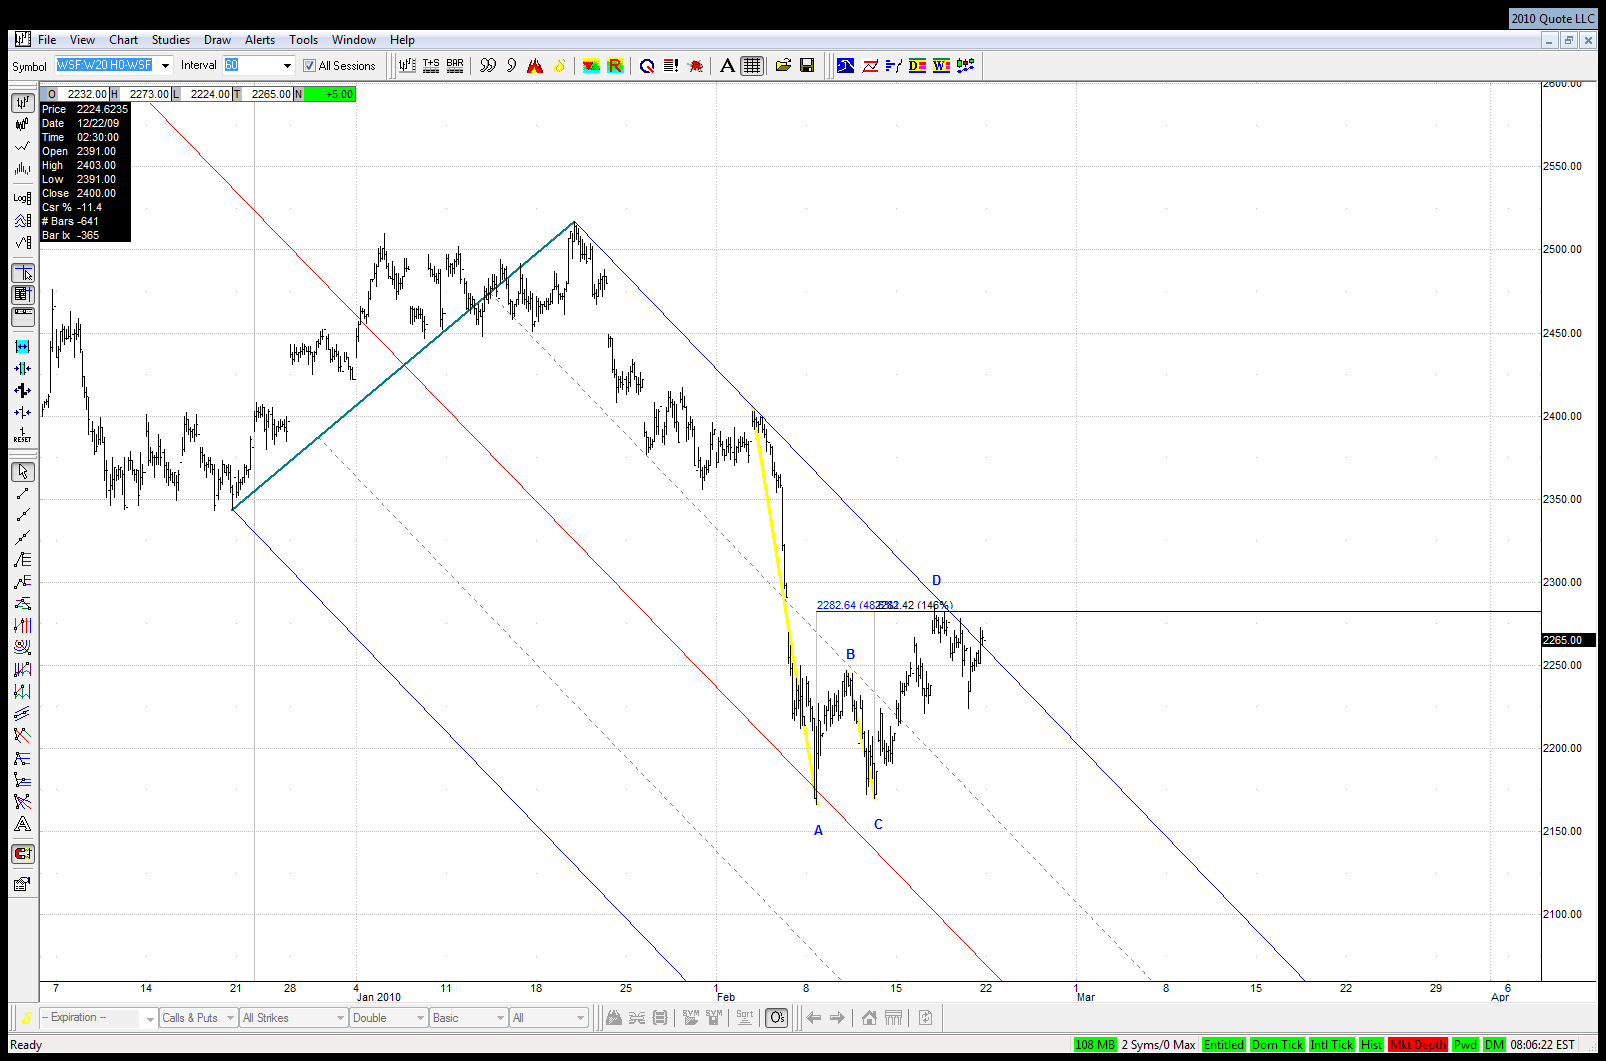
Both setups showed above failed, but the bounce didn't turn out to be strong either. In fact it is much weaker than those observed in other major markets and retraced so far only 38.2% of the previous drop:
It is possible that our futures have just completed DB Kane ABCD so it's again a major watch area:
Click image for original size
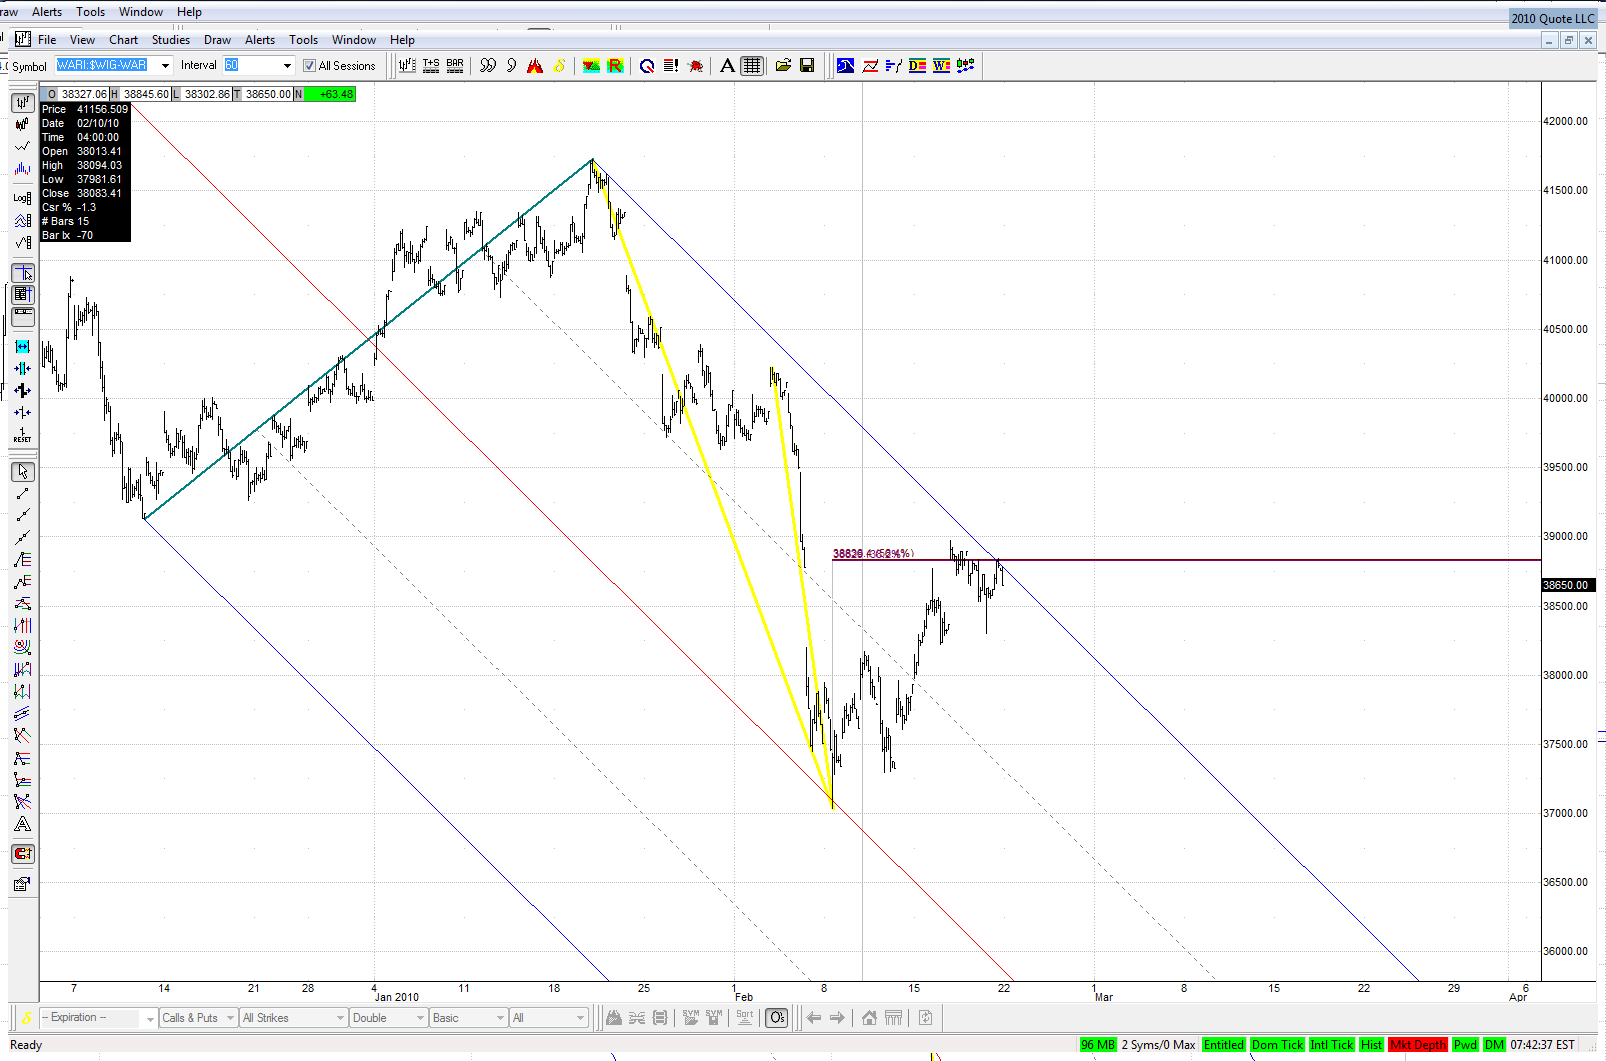
It is possible that our futures have just completed DB Kane ABCD so it's again a major watch area:
Click image for original size
JI
jimkane
Rep: 3,058
Posts: 33,089
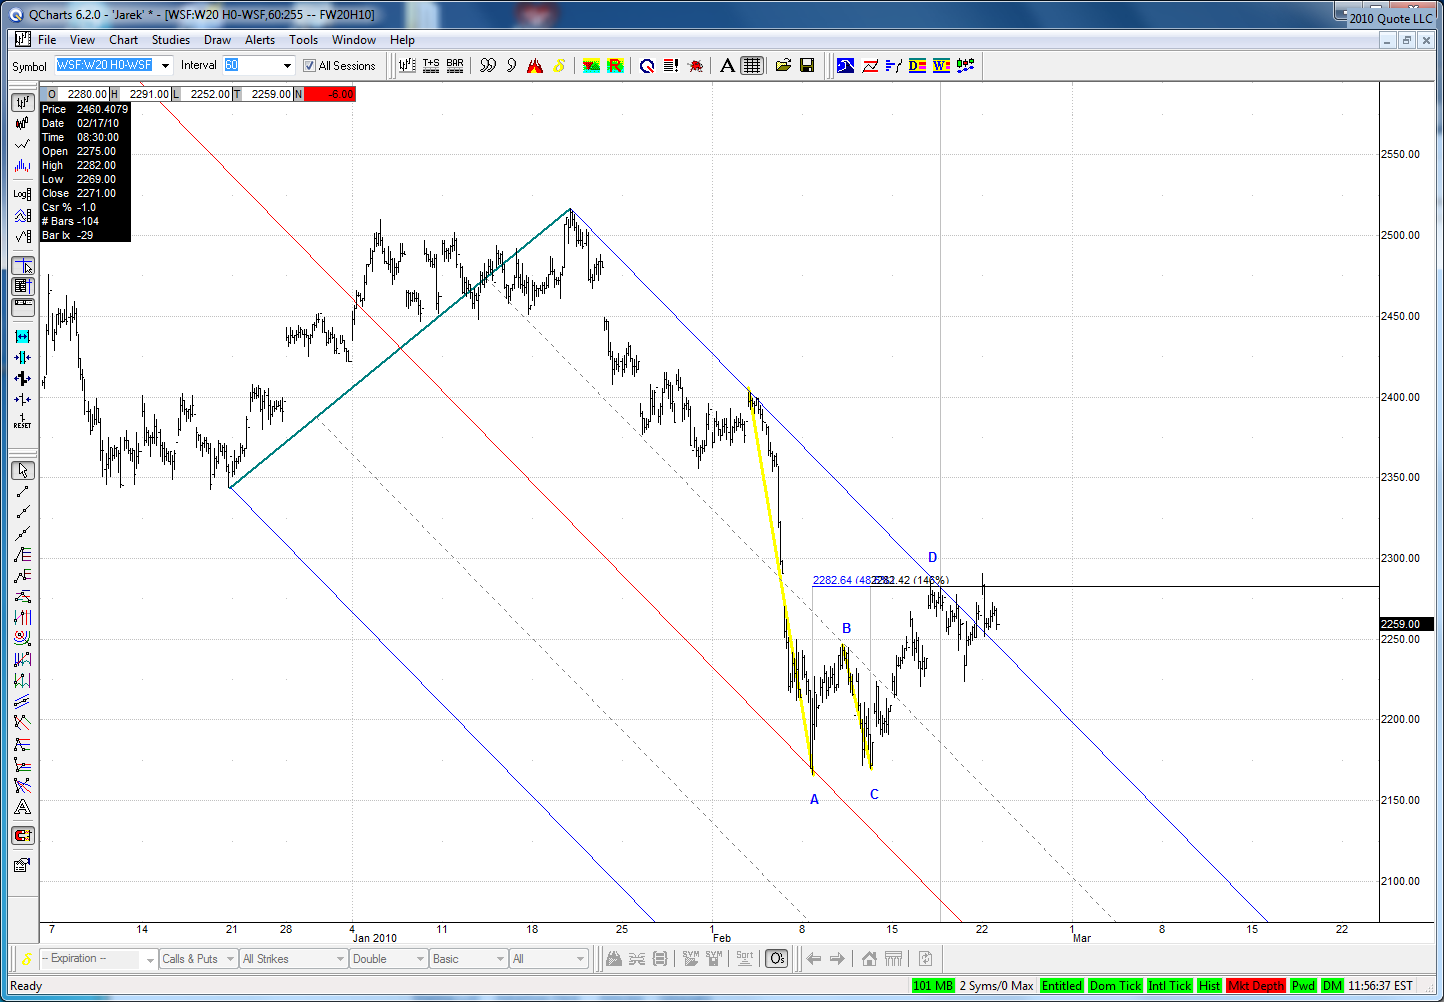
Your second chart there is a good example of 'trendline creep'. Not a great example, but a good one. This would tend to break to the upside. You have trendline creep when a line that should turn price action is instead 'creeped' along. Let's see how this one resolves.
JA
jarek
Rep: 94
Posts: 3,474
Originally posted by jimkane
...This would tend to break to the upside...
Indeed it broke to the upside with small opening gap, however quickly came back to the line. It remains to be seen whether it was a retest of the line from above or start of something more serious to the downside:
Click image for original size
JA
jarek
Rep: 94
Posts: 3,474
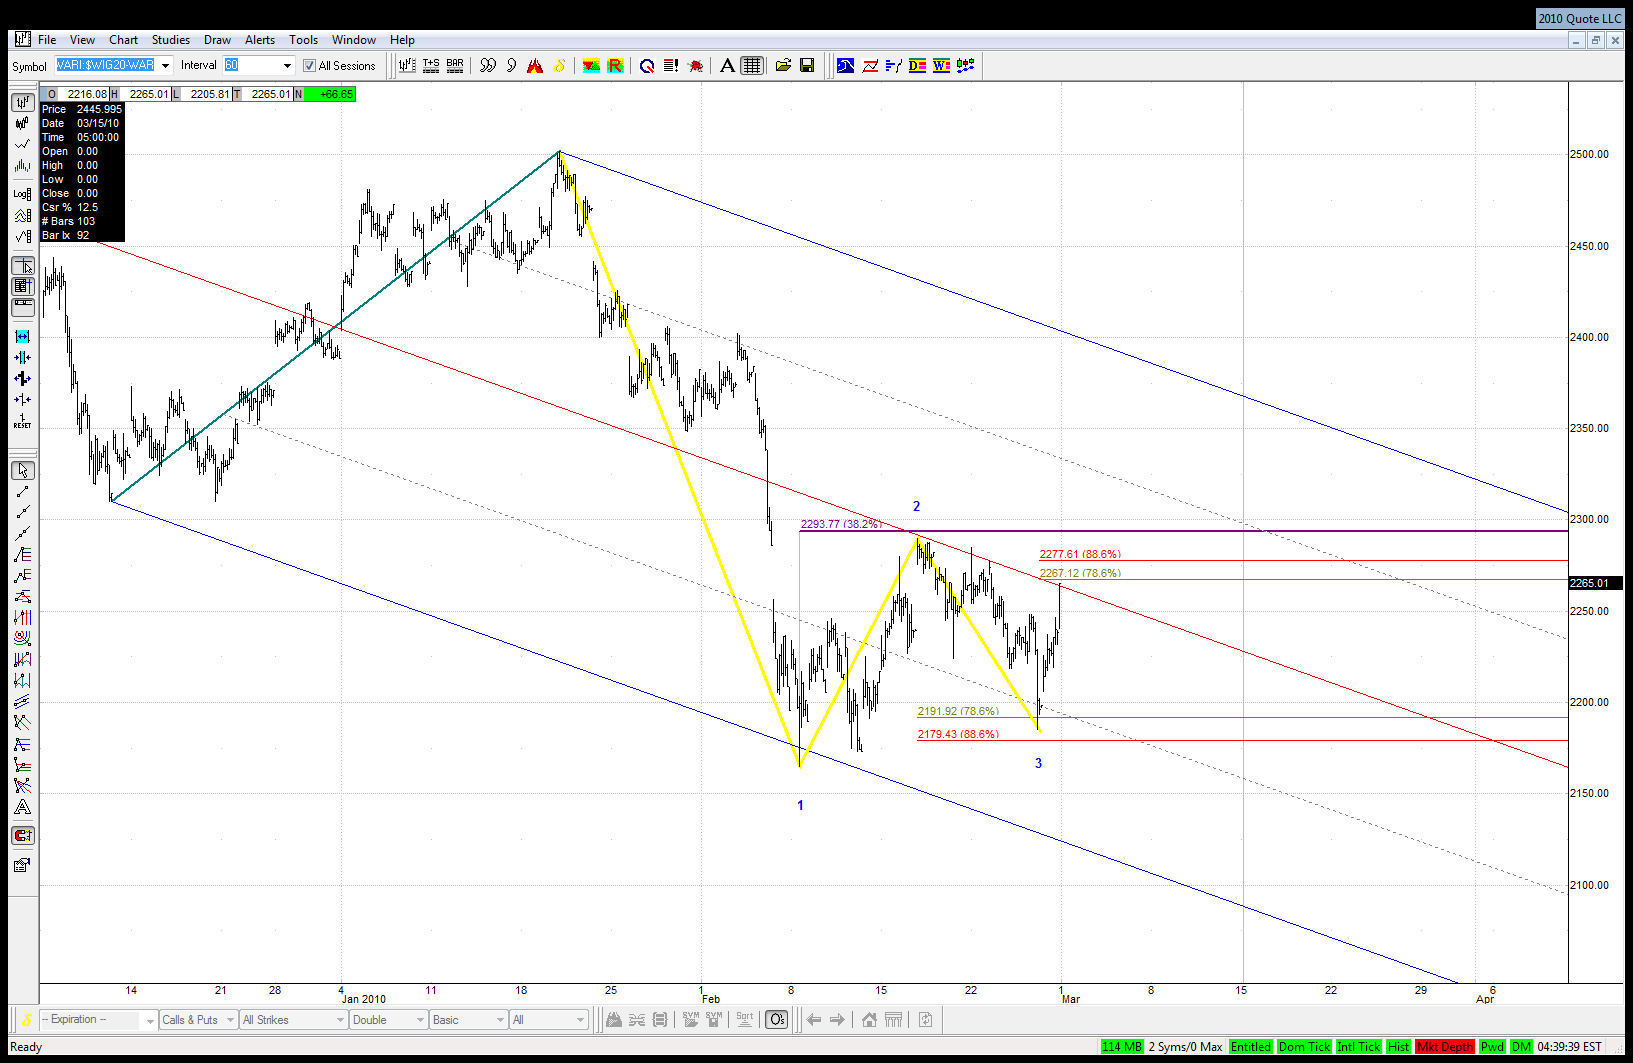
Our indexes are still relatively weak and remain under 38.2% retracement of Jan-Feb drop. Friday's session ended in very interesting spot - right at potential point number 4 of Kane 4PT:
If the setup fails we may witness strong break to the upside. On the other hand, if it holds then a strong move to the downside should ensue.
Click image for original size
If the setup fails we may witness strong break to the upside. On the other hand, if it holds then a strong move to the downside should ensue.