ES S/R Map for 11-16-09
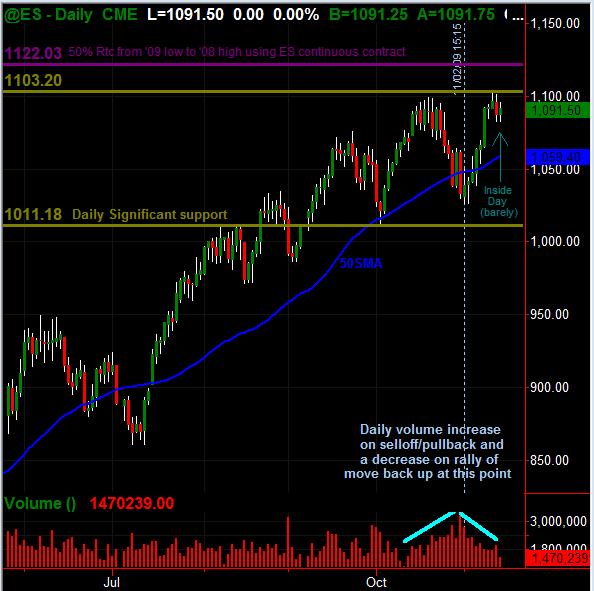
Bigger Picture daily chart first.
Click image for original size
ES price action S/R levels in light blue ... with red line as Wkly Mid Pvt. Also (in purple), have a swing high that was also an 88.6% retracement of past few days back up near the high. I include this because Jim Kane uses this as a significant fib rtc levle (correct me if I'm wrong Jimbo).
Hope this is useful to folks for coming into Monday's trading. I work off of price primarily (both S/R levels on the chart and reading price when it approaches these levels) where others steeped in Market Profile (like Bruce) derive levels or ZONES that come from a different angle of analysis. Always is nice when the two approaches end up with the same or similar levels.
As usual, I encourage all input and analysis and quesions etc. ... and love charts (labeled and/or explained). It's always great to work together ... at least for initial mapping and expections coming into a trading session.
Click image for original size
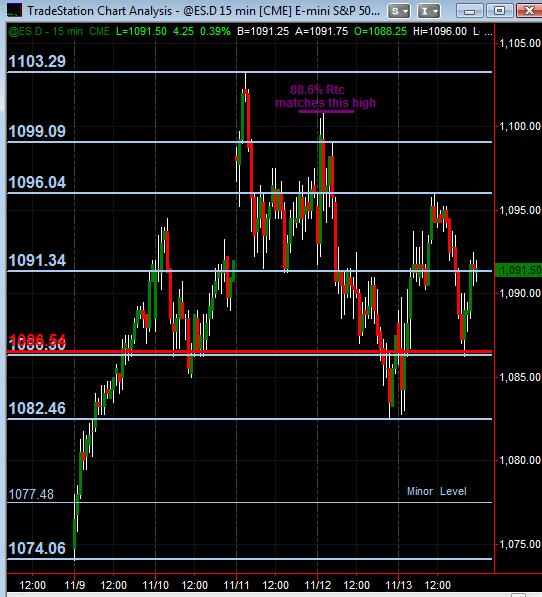
currently 7pm Central ... mkt traded up near S/R level of 1099 on above chart (hi of 98.50) ... backed off from there for now and trading currently at 1095.50
looking for posts for analysis from anyone and everyone ... and any commentary coming into tomorrow's trading session!!!!!
looking for posts for analysis from anyone and everyone ... and any commentary coming into tomorrow's trading session!!!!!
I am bullish and will continue..so looking to buy pullbacks/breakouts. Looks like we broke out of a bullish continuing flag on the 60min chart.
Thanks for the posts! On a side note, does anyone know why I'm showing ES trading on Saturday? I noticed this last week, too, with a TransAct feed. I don't have my IB feed anymore, but never used to show any trading on Saturday (bec. there isn't any). Or has that changed?!
I'm using the critical 1100, the 1092 magnet and the 1084 magnet..we need to monitor volume if/when they push it out of last weeks high but feel the 1100 is more important......I prefer short side up here at the 1100
anyone on the 1105...that's 5 above a key number and "air" below
I got long at 1104.75 for a push up scalp out of that stall that consolidated on 1min chart ... but getting near Open+8/10 which is also near Wkly R1 Pvt at 1108 area ... will see if price shows it's "spent" if it gets near there, likely will be looking for a short back down to around 1100 area (maybe further) ... but this is still acting strong ... out of long @1107.00
next level of potential signif resistance is 1113-1115 zone above current price if exceeds that 1108 area ... not sure where to short this thing for now ... gonna let price give me some kind of clue first
next level of potential signif resistance is 1113-1115 zone above current price if exceeds that 1108 area ... not sure where to short this thing for now ... gonna let price give me some kind of clue first
gotthe 105 's and the plus 10 number ....1109....I'm really cautious and remember last monday's run...
1103.75 is my first target if those doesn't run away from me....that is where air starts
Just back from the dentist....he actually made me money with my 1105.25 exit earlier...shorting agin at 1111.50..smaller and more wiggle room....1109 and 1105 are key volume magnets IF this rolls over to the downside....
good hold short ... some good rationale ... I never shorted, only had 2 long trades this morning on the gap and run, worked scalps off momentum.
have 1103 as support area ... could drop some if broken below but running out of time
have 1103 as support area ... could drop some if broken below but running out of time
Emini Day Trading /
Daily Notes /
Forecast /
Economic Events /
Search /
Terms and Conditions /
Disclaimer /
Books /
Online Books /
Site Map /
Contact /
Privacy Policy /
Links /
About /
Day Trading Forum /
Investment Calculators /
Pivot Point Calculator /
Market Profile Generator /
Fibonacci Calculator /
Mailing List /
Advertise Here /
Articles /
Financial Terms /
Brokers /
Software /
Holidays /
Stock Split Calendar /
Mortgage Calculator /
Donate
Copyright © 2004-2023, MyPivots. All rights reserved.
Copyright © 2004-2023, MyPivots. All rights reserved.