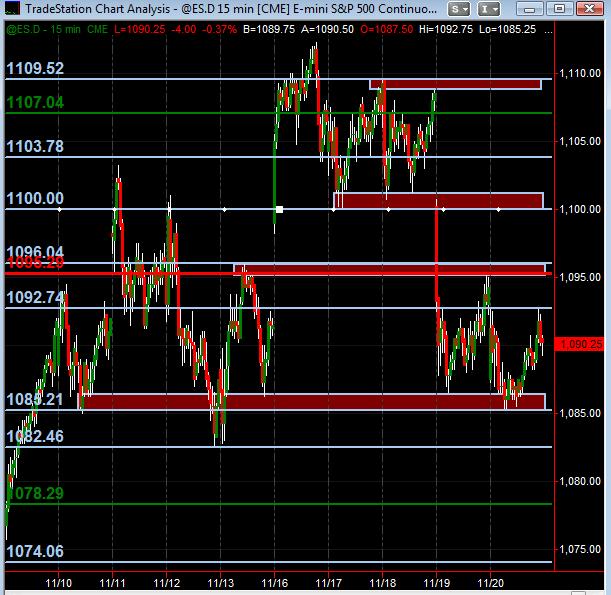
ES S/R Map for 11-23-09
Cyan lines are price action S/R levels (with some zones drawn in maroon). Red line is Wkly Mid Pvt ... and Green lines are Wkly S1 and R1. As always, open to any feedback and additional analysis!!!
Click image for original size
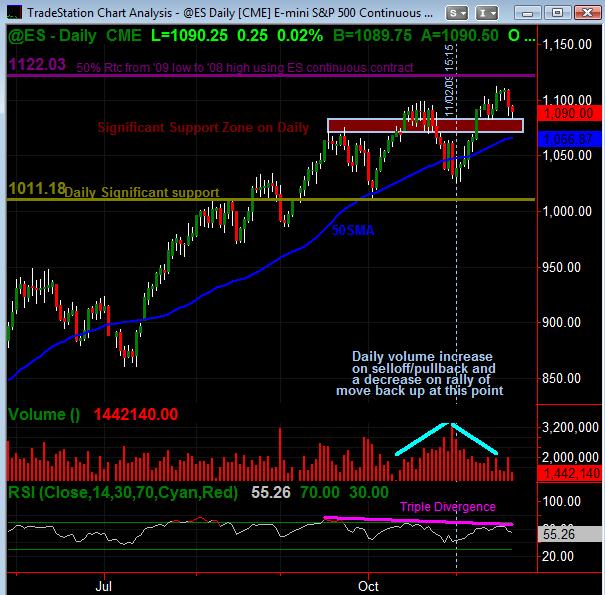
And a daily chart for the bigger picture.
Click image for original size
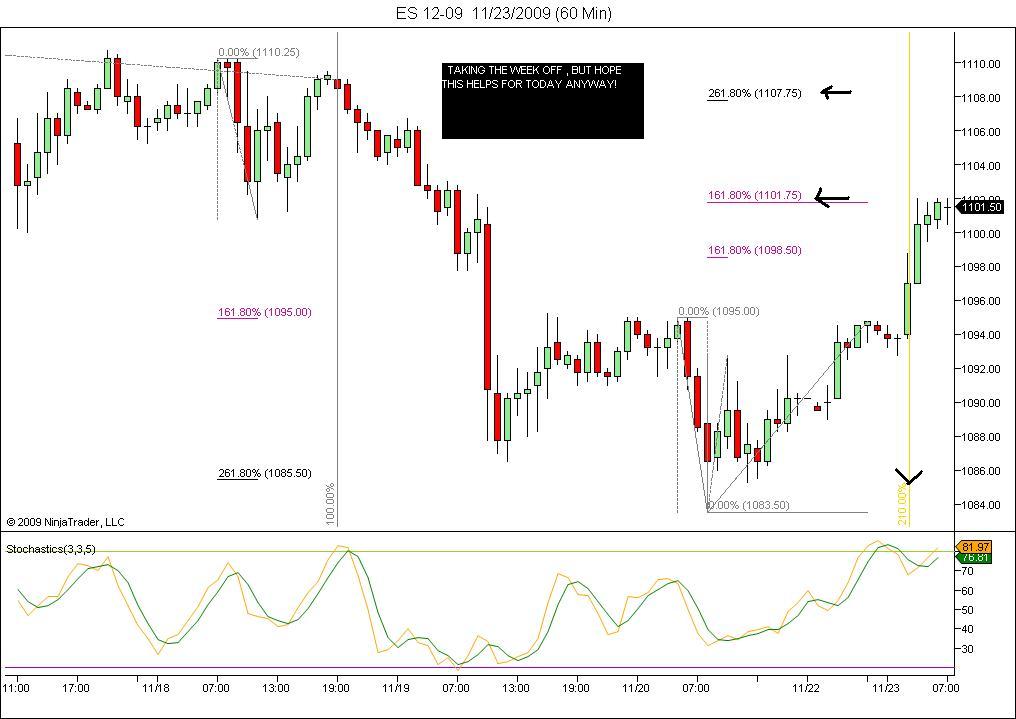
Click image for original size
I'm expecting them to jerk it around that 98.75 area based on the overnight so far.....still using the 1103 and the 92 as magnets though in the day session...Mondays have been strong lately ..at least early on...I still prefer to try and fade this gap up
Hey Kool...u had a 1103 projection on Friday and early on so well done on that........I hope everyone has a great Thanksgiving ...I'll be going a bit lighter with this pre holiday Monday.....
MM: 1097.50, 1099.50, 1101.50, 1103.50, 1105.50
Weekly Swing Pattern: Monday High , Friday Low
Res: 1106, 1114
Sup: 1089, 1081, 1073
Happy Thanksgiving everyone !
Weekly Swing Pattern: Monday High , Friday Low
Res: 1106, 1114
Sup: 1089, 1081, 1073
Happy Thanksgiving everyone !
that's me light and on the 1103 short.....overnight...yikes...want the 98.75 but will tighten if they get it back to 1100...big volume but not me....chicken...that describes me...
I find over 90% of the time that my overnight initiated trades are worthless....meaning they don't do anything that I couldn't achieve by waiting for the RTH open
started RTH shorts at the plus 4 now.......
added at the plus 8...damn mondays....air at 1105..sdtill don't likje it
I am looking for one good 2.5 pt long on the Emini NQ and be done for the day.
Yes Guru I too hope so. Finally got over excessive trading and using indicators. Now just look at charts and how price acts at certain levels. Will add if it goes against 10 pts against me. Relaxing so far
Emini Day Trading /
Daily Notes /
Forecast /
Economic Events /
Search /
Terms and Conditions /
Disclaimer /
Books /
Online Books /
Site Map /
Contact /
Privacy Policy /
Links /
About /
Day Trading Forum /
Investment Calculators /
Pivot Point Calculator /
Market Profile Generator /
Fibonacci Calculator /
Mailing List /
Advertise Here /
Articles /
Financial Terms /
Brokers /
Software /
Holidays /
Stock Split Calendar /
Mortgage Calculator /
Donate
Copyright © 2004-2023, MyPivots. All rights reserved.
Copyright © 2004-2023, MyPivots. All rights reserved.