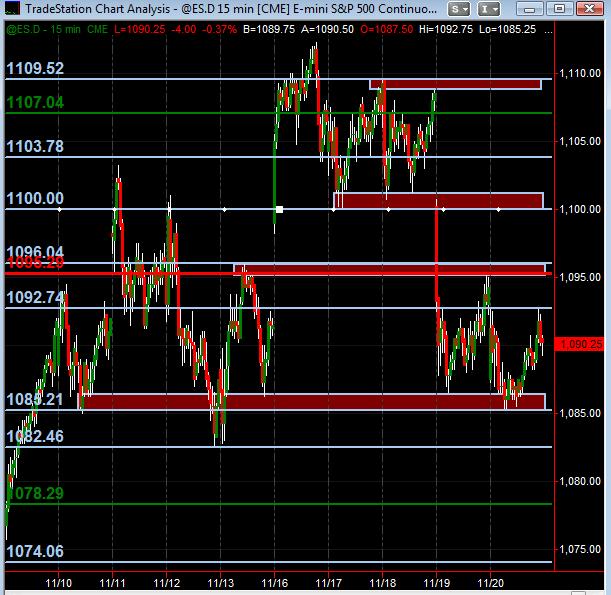
ES S/R Map for 11-23-09
Cyan lines are price action S/R levels (with some zones drawn in maroon). Red line is Wkly Mid Pvt ... and Green lines are Wkly S1 and R1. As always, open to any feedback and additional analysis!!!
Click image for original size
so was all that volume from those who shorted the gap exiting? We know they are taught to risk 50% of a gap amount to target the full gap....hour range high looms above.....
1798.25 looks good to me
Entered short at 1800.75 for exit
One trade a day would be cool AK1....I probably couldn't do that but don't trade nearly as much as I use to....addicted somedays I guess to the challenge of going against players who have so much more money then me....like yourself...lol..hope the trade goes your way
s&P forming the "P" pattern and I hope it's enough to officially roll this over down
s&P forming the "P" pattern and I hope it's enough to officially roll this over down
Yes Guru I too hope so. Finally got over excessive trading and using indicators. Now just look at charts and how price acts at certain levels. Will add if it goes against 10 pts against me. Relaxing so far
Emini Day Trading /
Daily Notes /
Forecast /
Economic Events /
Search /
Terms and Conditions /
Disclaimer /
Books /
Online Books /
Site Map /
Contact /
Privacy Policy /
Links /
About /
Day Trading Forum /
Investment Calculators /
Pivot Point Calculator /
Market Profile Generator /
Fibonacci Calculator /
Mailing List /
Advertise Here /
Articles /
Financial Terms /
Brokers /
Software /
Holidays /
Stock Split Calendar /
Mortgage Calculator /
Donate
Copyright © 2004-2023, MyPivots. All rights reserved.
Copyright © 2004-2023, MyPivots. All rights reserved.