S&P Reversals & Targets
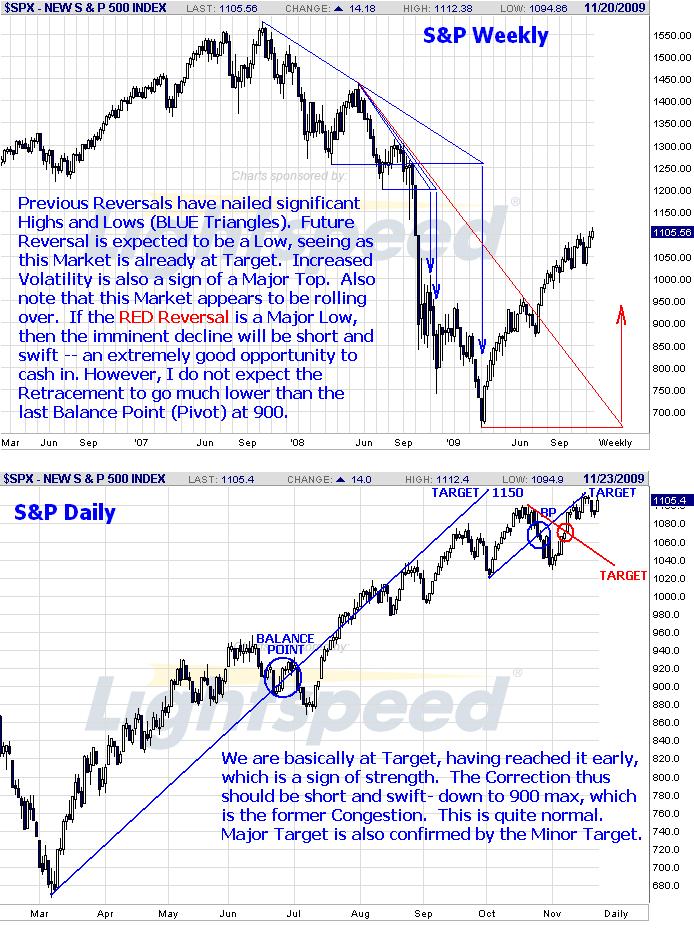
The Charts below show past and future Reversals and Targets. The S&P is at a significant Top. Increased Volatility and other factors are confirming this. I would be surprised if it broke Monday's high. Today's opening move looks very much like an Exhaustion Bar to me, with prices set to collapse imminently. Once the 1-2-3 is broken on the 60-min Chart, then we should be good to go for a Significant Decline.
These Studies can also be extrapolated from 60-min down to 1-min Reversals. That would reduce risk substantially. Note that these are Charts for the S&P, and NOT of the Futures Contract.
Good Trading,
Doer
These Studies can also be extrapolated from 60-min down to 1-min Reversals. That would reduce risk substantially. Note that these are Charts for the S&P, and NOT of the Futures Contract.
Good Trading,
Doer
Click image for original size
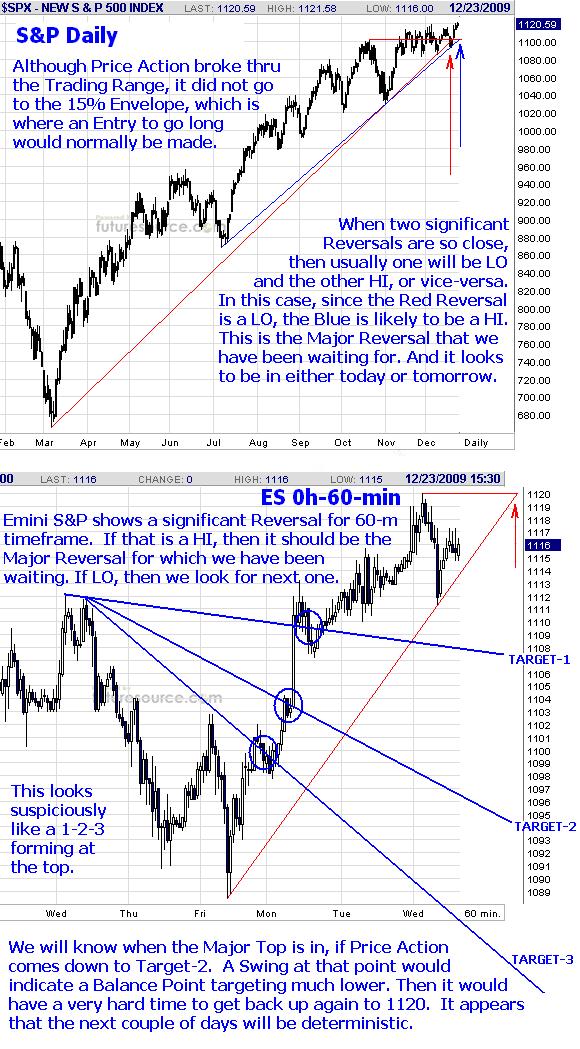
I forgot something very important. Charts below explain that, plus give the Emini Futures Chart instead of the regular S&P, since we are trading the Futures. It appears that the Major Top is in. If not, then it will be tested tomorrow.
Price Action broke thru the 31-Bar Trading Range to the upside and tried to break thru the 15% Envelope, getting within a couple of ticks of that. But it would surprise me if it actually did go higher, so I am definitely NOT going long right now. Instead we wait for confirmation of the Major Top on the Hourly Chart.
The next significant Reversal there will tell the tale. IF it is a HI, then that is a "Screaming Sell" Signal. But if a LO, then we wait for the next Reversal to see if it is a HI.
The Reversal could also be a Balance Point targeting further in the same direction, whether that be long or short. But then it would form an Inversion with a tell-tale signature, and we trade accordingly.
We watch and wait. Opportunity is knocking.
Good Trading,
Doer
Click image for original size
Christmas Update
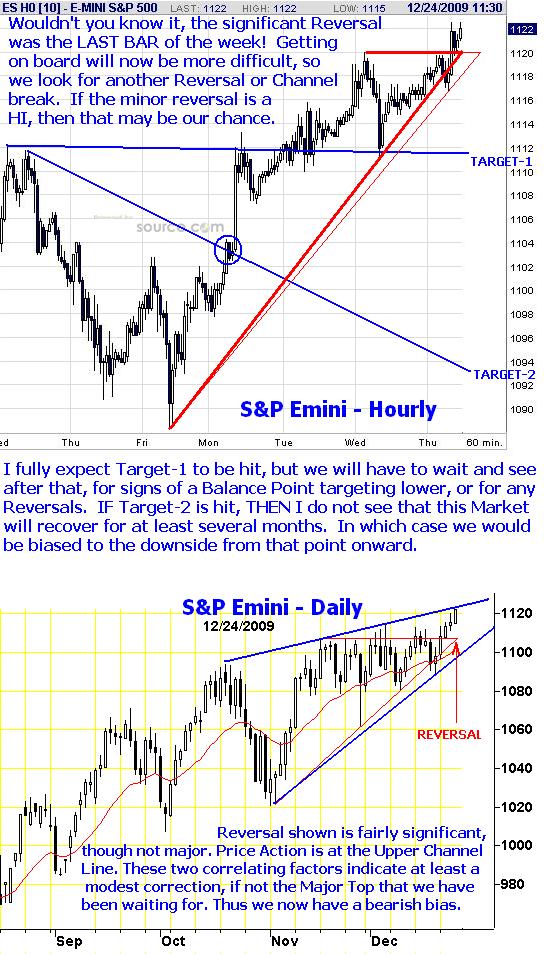
I did not realize that the significant Reversal on the Hourly Chart of the Emini S&P would be the LAST BAR before the long Christmas Weekend. We should not be trading during this time, anyway, because the Markets are very thin and stop-running is rampant. This is evidenced by big Spikes on the Japanese Candles. Not so much in the S&P, which is probably the most liquid Futures Contract in the world, but you can see it even in otherwise-liquid contracts such as BP. So time with Family is more advisable than sitting in front of a computer screen. That is my plan this weekend, so this is my last post for awhile.
Certainly I would not be in this Market over the weekend now, even with such a clear signal as the significant Reversals on the Daily and Hourly Charts. The Hourly Chart even made a Double Top, which is another indicator that a significant high may be in. Interestingly, Price Action took out the 15% Envelope around the Trading Range of the last 30 Bars, but I do not take that Breakout Long. It looks too much like a False Breakout to me.
So what do we do next? Monday should see a Gap Down when this Market opens. If not, and the high is taken out significantly, then that would mean a new Balance Point targeting slightly higher, and I would wait for developments.
But if, as anticipated, the Price Action is to the downside, then the Targets are very clear. Only getting on board would be a problem, as Price Acton could be volatile. So I would look for a Reversal High on the Hourly Chart, or Breakout of a Channel to get on.
Note that this Market is at the Upper Channel Line of a significant Channel, at a Reversal and also at several Targets, both major and minor. That is a TRIPLE WHAMMY, and at least a 90% shot. It doesn't get much better.
Merry Christmas,
Doer
Click image for original size
Emini Day Trading /
Daily Notes /
Forecast /
Economic Events /
Search /
Terms and Conditions /
Disclaimer /
Books /
Online Books /
Site Map /
Contact /
Privacy Policy /
Links /
About /
Day Trading Forum /
Investment Calculators /
Pivot Point Calculator /
Market Profile Generator /
Fibonacci Calculator /
Mailing List /
Advertise Here /
Articles /
Financial Terms /
Brokers /
Software /
Holidays /
Stock Split Calendar /
Mortgage Calculator /
Donate
Copyright © 2004-2023, MyPivots. All rights reserved.
Copyright © 2004-2023, MyPivots. All rights reserved.