ES 12-02-09
Happy full moon day!...LOL....
Click image for original size
...Click image for original size
Click image for original size

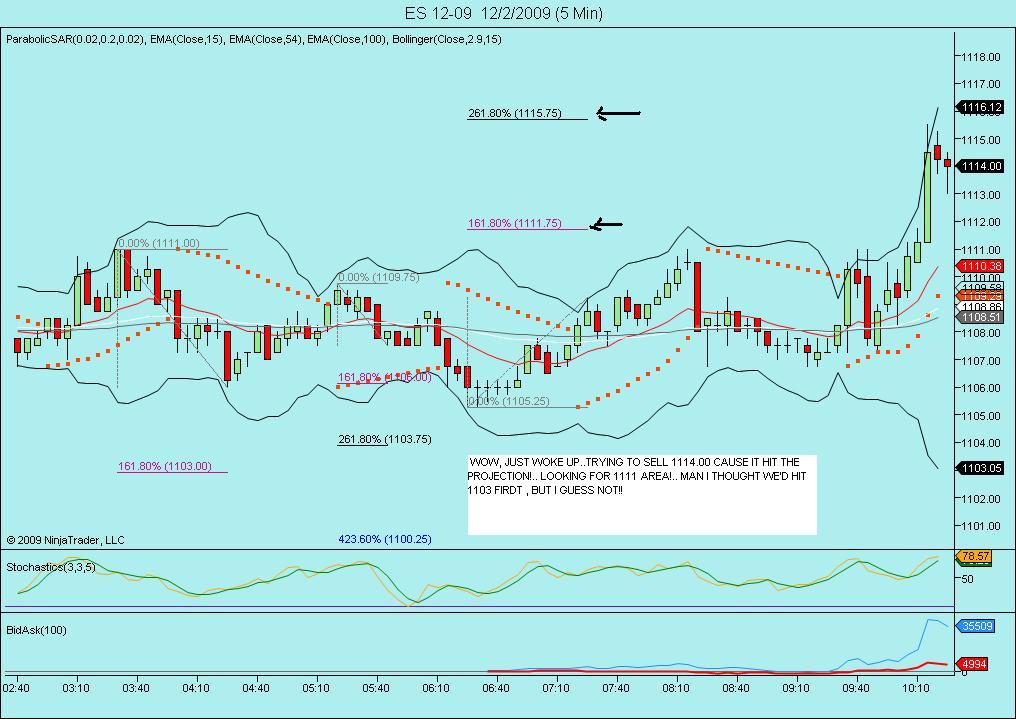
FWIW.... my red avg on the 5 min chart (potential short term support) is currently at 1111.50.
my order to exit is at 1111.75 so this action is driving me nuts!
Bingo!!! out at 1111.75..plus 2.25 on 2 es.. up 4.5 on the day. Now watch to see if it turns here or goes for the 1109 projection.
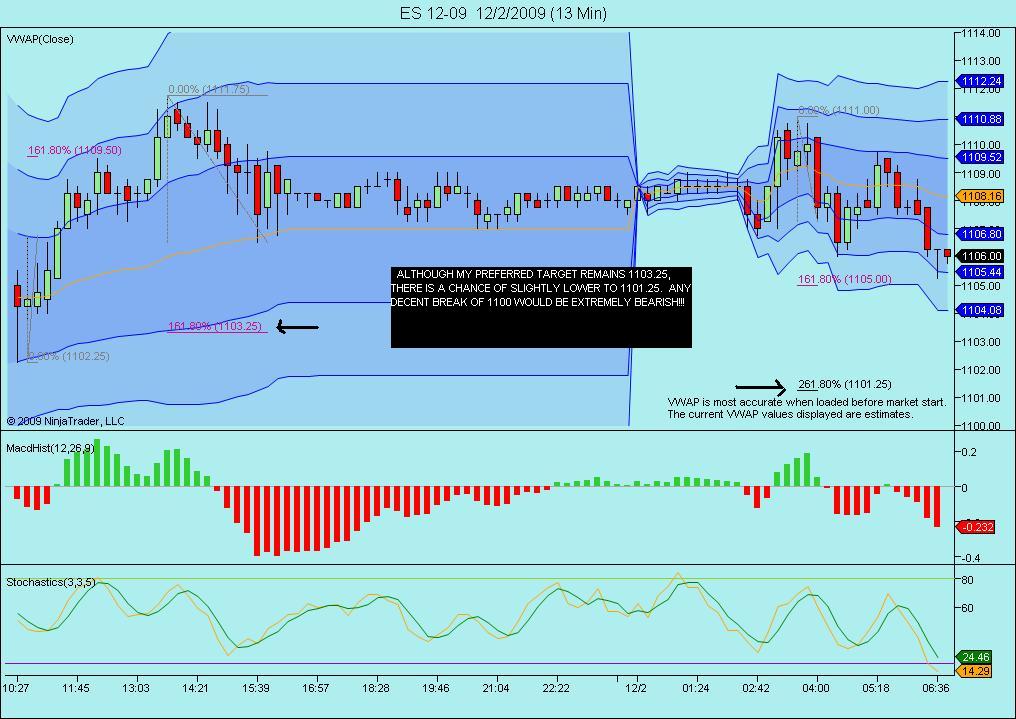
ok, now that i have a few min , let me explain my nervousness. THE AVG DAILY RANGE IS AROUND 19 OR SO HANDLES. The low so far is 1105.25. Now in truth i dont expect it to exactly hit the 19 handles, but even if it goes around 16 or so ,that would be 1121. and i notice Demarks high pivot is 1119.75. also i already have projections on longer term charts to around 1117.50-1118.50 so ,basically im still looking for upside today. Thats why im being conservative on this little pullback.
If i might blow my own horn a bit... followers of this thread know ive been bullish since March, and remain so! All of the 'experts' and wave riders have been trying to pick a top almost daily! As i like to say, let the market tell you when its time to change... and it hasnt done so yet! It came close imho at the 1026 low, but never quite got there! (if memory serves i was looking for 985 and a break of that would have changed my mind!). On the 'bigger' picture, you can expect higher thru dec and into jan.
Remember , as ive often mentioned, when you see new highs diminish, and new lows begin to soar, (where new lows exceed new highs) ,that will the time to go to cash in the 401k!
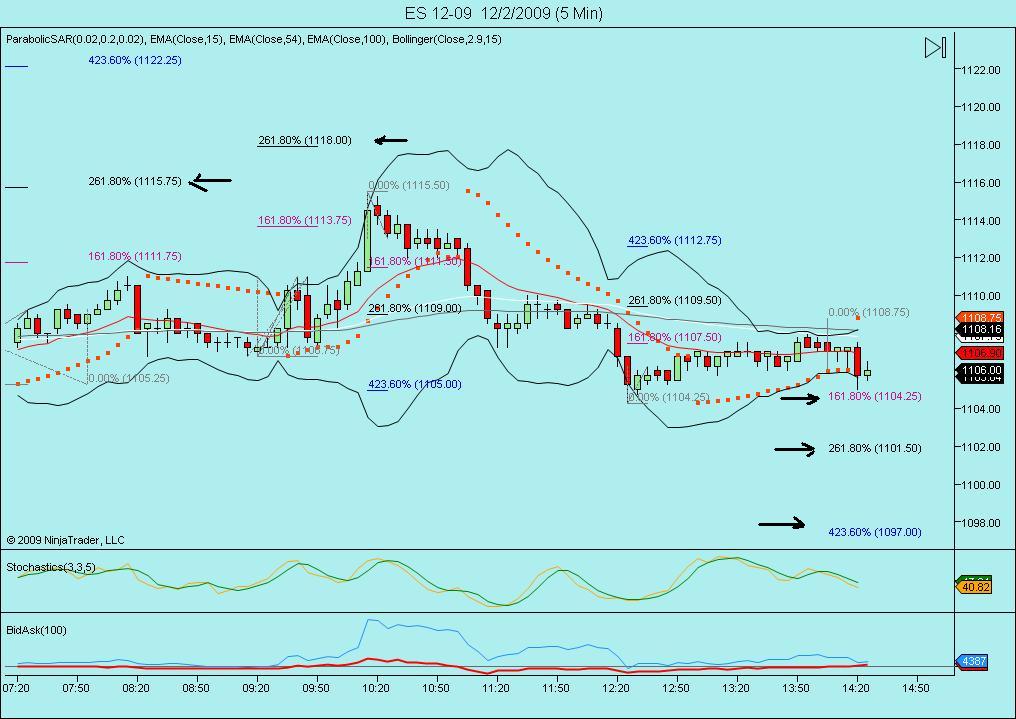
wow, look at the action! order to buy at 1106.25..I'll explain shortly!
sell the rally into a moon....no?
Click image for original size
Emini Day Trading /
Daily Notes /
Forecast /
Economic Events /
Search /
Terms and Conditions /
Disclaimer /
Books /
Online Books /
Site Map /
Contact /
Privacy Policy /
Links /
About /
Day Trading Forum /
Investment Calculators /
Pivot Point Calculator /
Market Profile Generator /
Fibonacci Calculator /
Mailing List /
Advertise Here /
Articles /
Financial Terms /
Brokers /
Software /
Holidays /
Stock Split Calendar /
Mortgage Calculator /
Donate
Copyright © 2004-2023, MyPivots. All rights reserved.
Copyright © 2004-2023, MyPivots. All rights reserved.