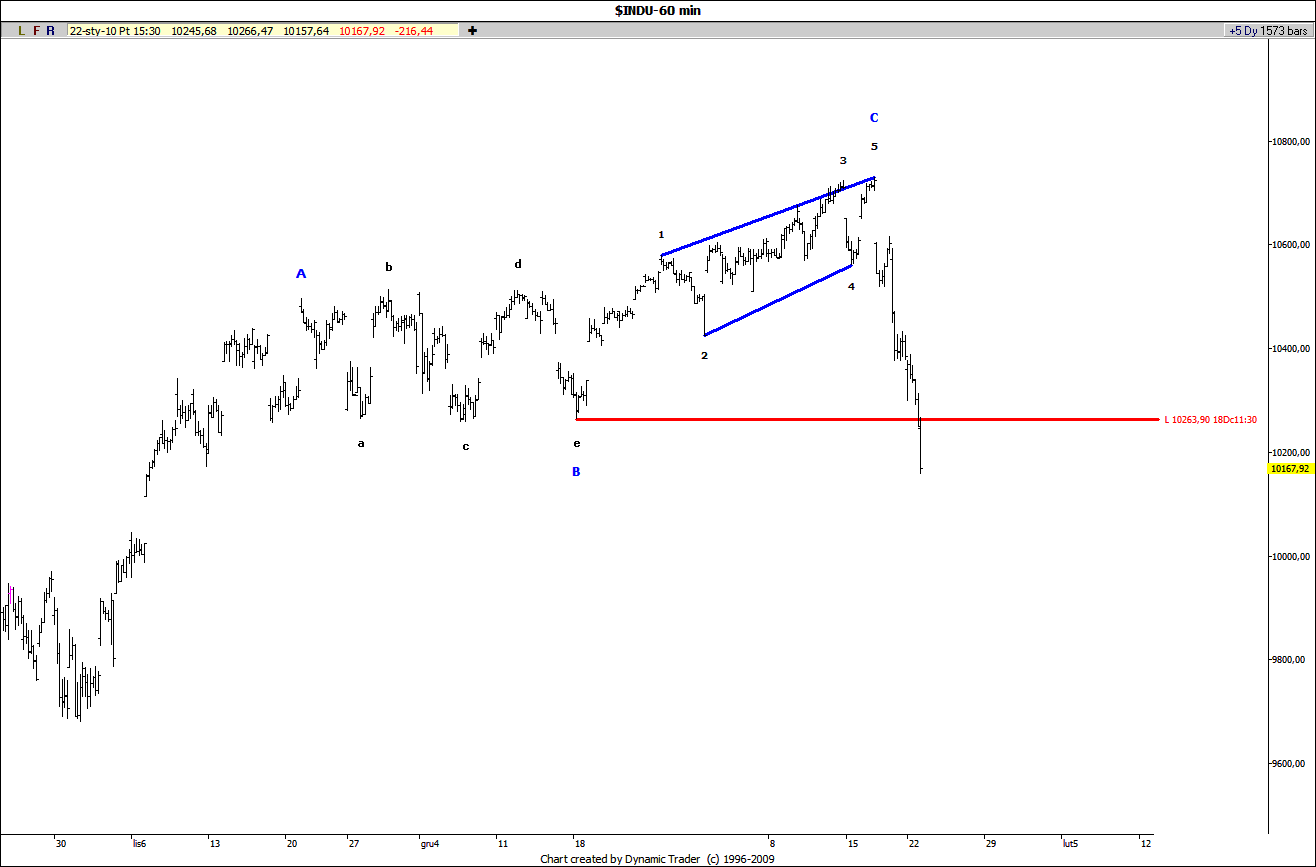
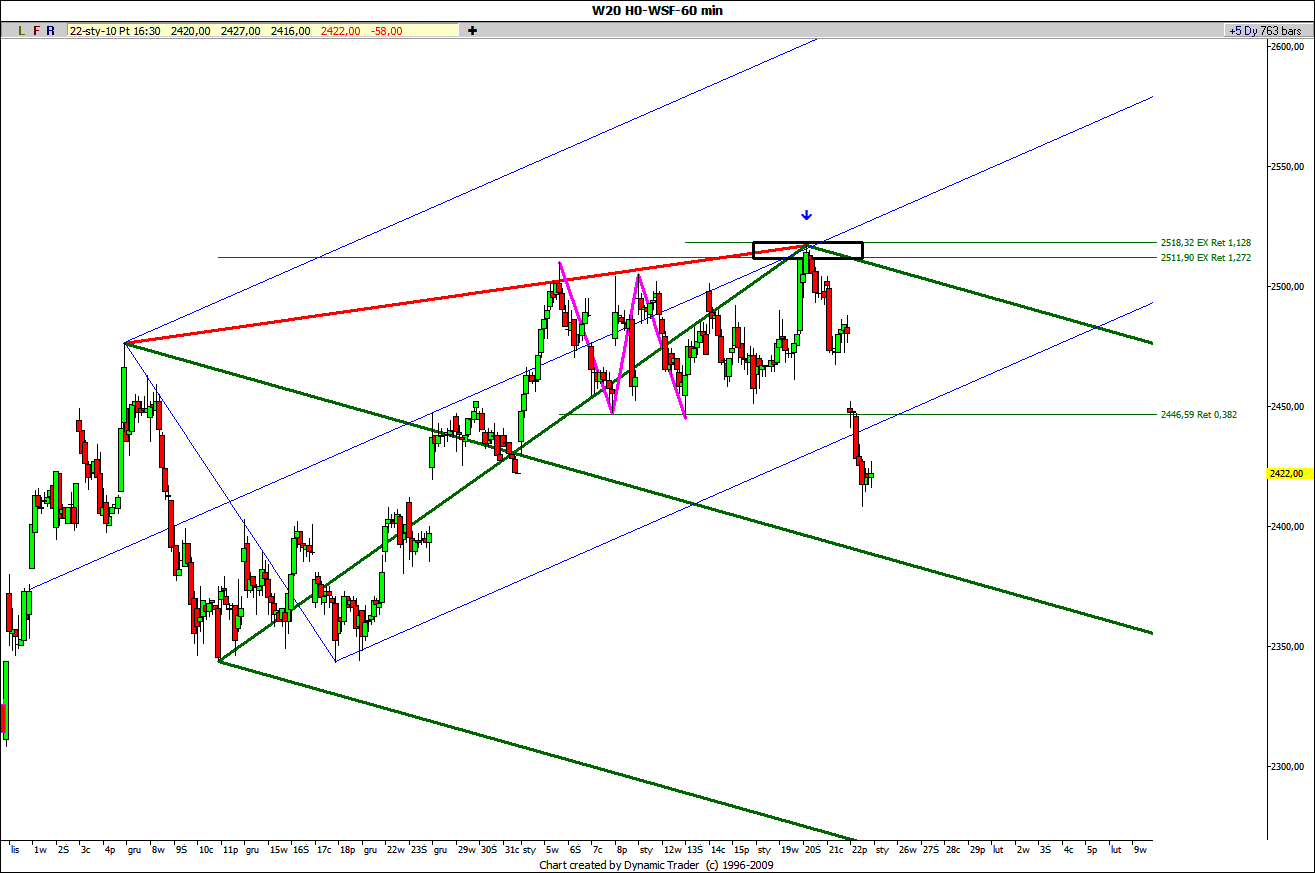
For the next 2 weekends I’ll be out skiing so I would like to show some updates of the charts we are following here. First of all we may be certain that Ending Diagonal on DJIA I was showing here many times was finally completed:
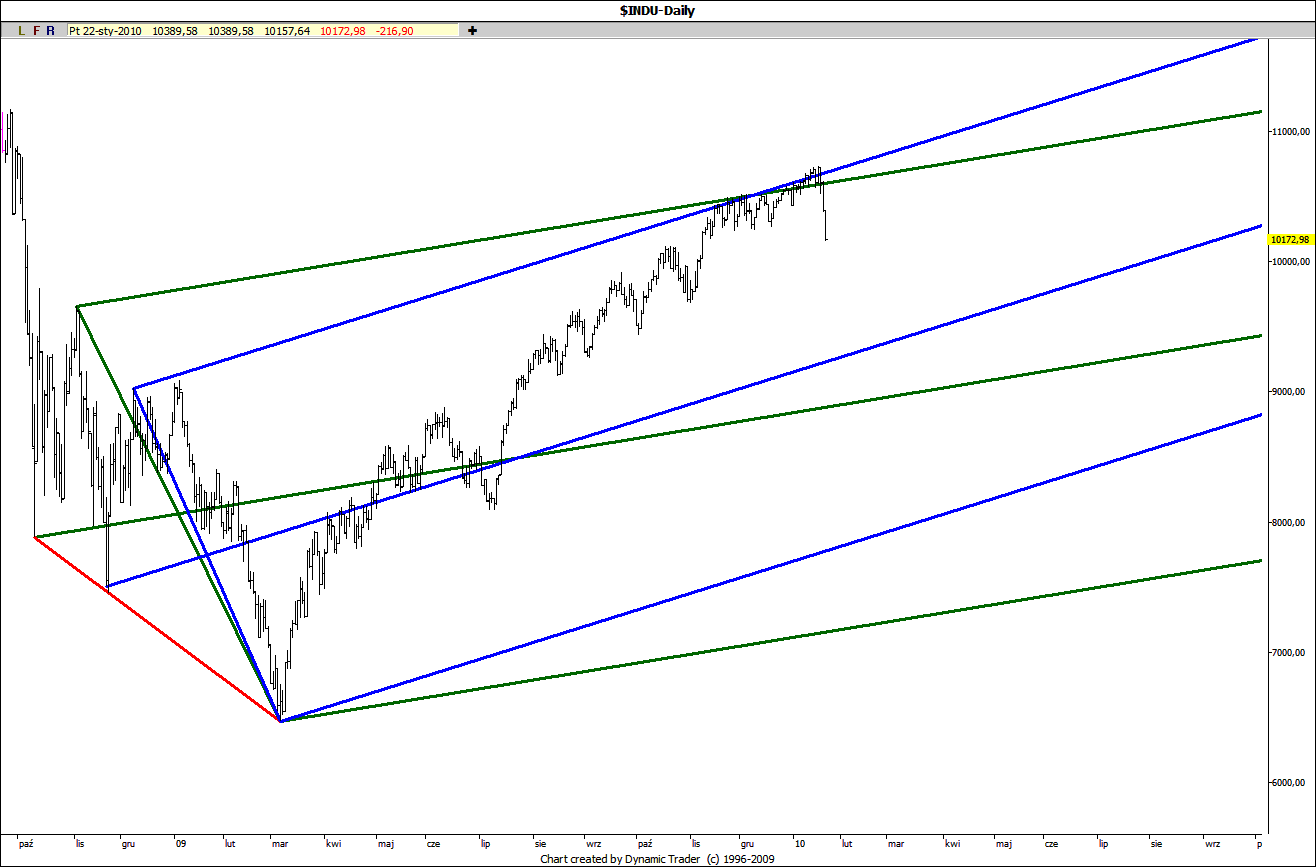
The behavior of the market after completing an ED was a textbook classic – free fall to the base of the formation. And since Ending Diagonals can either be wave 5 or wave C of something bigger, then the recent selloff simply has to be a start of something more serious to the downside. Maybe the MLs of our 2 DJIA sets which in my opinion are still in play could be next targets?
JA
jarek
Rep: 94
Posts: 3,474
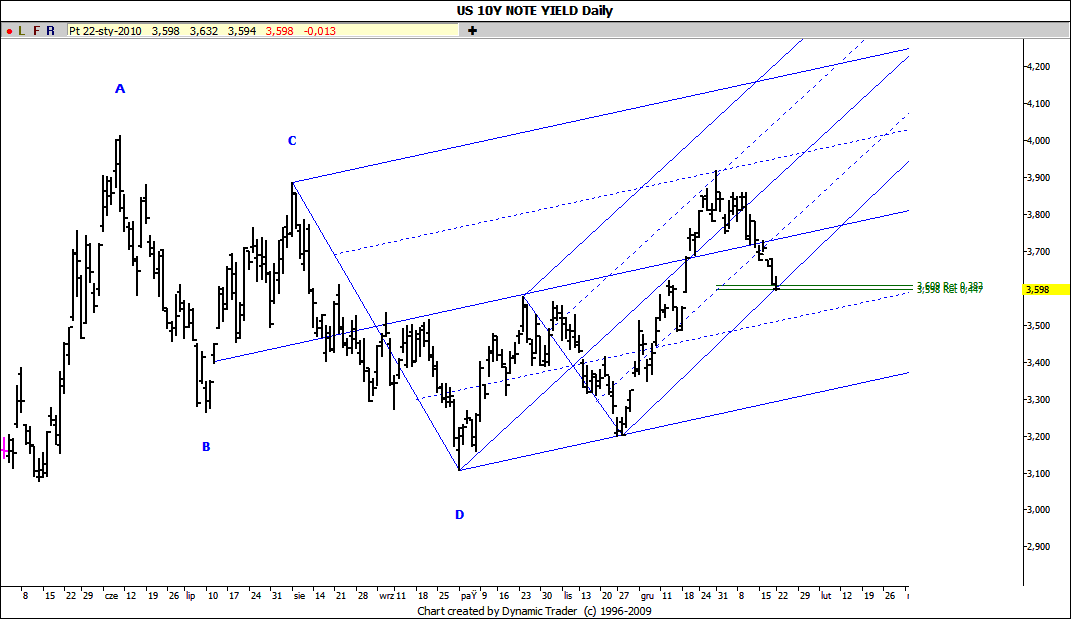
And the reason for the continuation of a selloff might be a strengthening dollar in the result of rising rates. 10Y Notes closed on Friday in a in very interesting spot: right at a line and two key trend continuation fibs from Jim’s repertoire:
If the recent drop was a wave 2 of 3 than we have our puzzle solved.
Isn't it fascinating that the political developments of the last few days may play very well into such scenario? The more people think Paul Volcker the more they will see higher rates. It may be a self- fulfilling prophecy...
If the recent drop was a wave 2 of 3 than we have our puzzle solved.
Isn't it fascinating that the political developments of the last few days may play very well into such scenario? The more people think Paul Volcker the more they will see higher rates. It may be a self- fulfilling prophecy...
JA
jarek
Rep: 94
Posts: 3,474
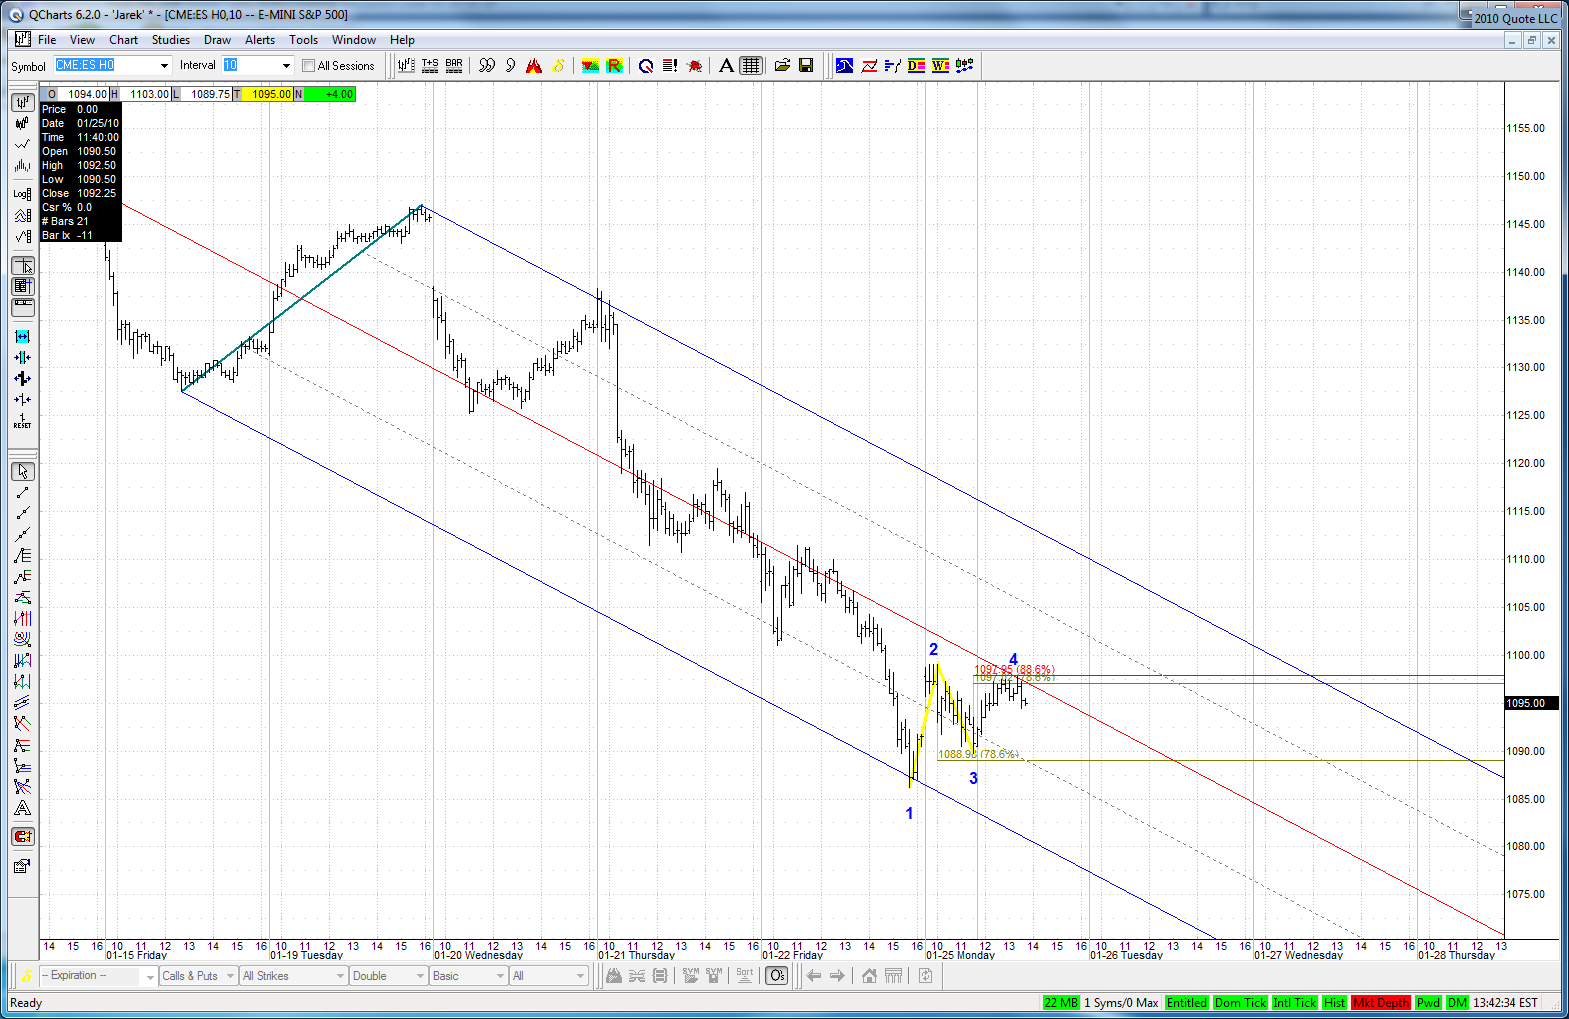
Sure - here is the chart:
The last setup shown here on January 10th didn't play out. But no wonder - Kane ABCD set up against it right at .382 with 87% chance of taking out the high :-) This time everything went according to the plan. We should drop to the green line tomorrow at the open since the late day Friday selloff on Wall Street isn't priced in yet.
JI
jimkane
Rep: 3,058
Posts: 33,089
Nice chartwork, jarek. One question, though, I thought you said last week that the ending diagonal in the INDU, based on the move it made, was invalidated. Not so?
JA
jarek
Rep: 94
Posts: 3,474
Originally posted by jimkane
...One question, though, I thought you said last week that the ending diagonal in the INDU, based on the move it made, was invalidated. Not so?
Invalidated was only my count shown here last Sunday and not the whole ending diagonal idea. This count assumed that ED ended on Jan 14th whereas in fact it was only the end of its wave 3. When on last Tuesday morning the drop from previous Friday was not continued it was already obvious that ED was not finished yet. When it ends there has to be a free fall to the start point of wave 1. Exactly how it happened few days later.
JI
jimkane
Rep: 3,058
Posts: 33,089
Thanks, jarek, I just didn't understand the original post, it seems.
JI
jimkane
Rep: 3,058
Posts: 33,089
Yes, 4 PT's can work quite well with .685's, and I have one student who particularly likes them and looks for them. The biggest issue I have here is how far this has dropped, how small that correction is, and that we are 'on support' to an extent.
JI
jimkane
Rep: 3,058
Posts: 33,089
This GLOBEX action is just incredible. Can't say I like the idea of sleeping from 2PM-8/9PM (or in two hour blips, or not at all...), but this action is just insane. Down about 9 points, up about 5 points, down another 9 points to within less than a tick of the 1.272, and then up over 10 points like a rocketship. And it's only midnight pacific time! This is just amazing!