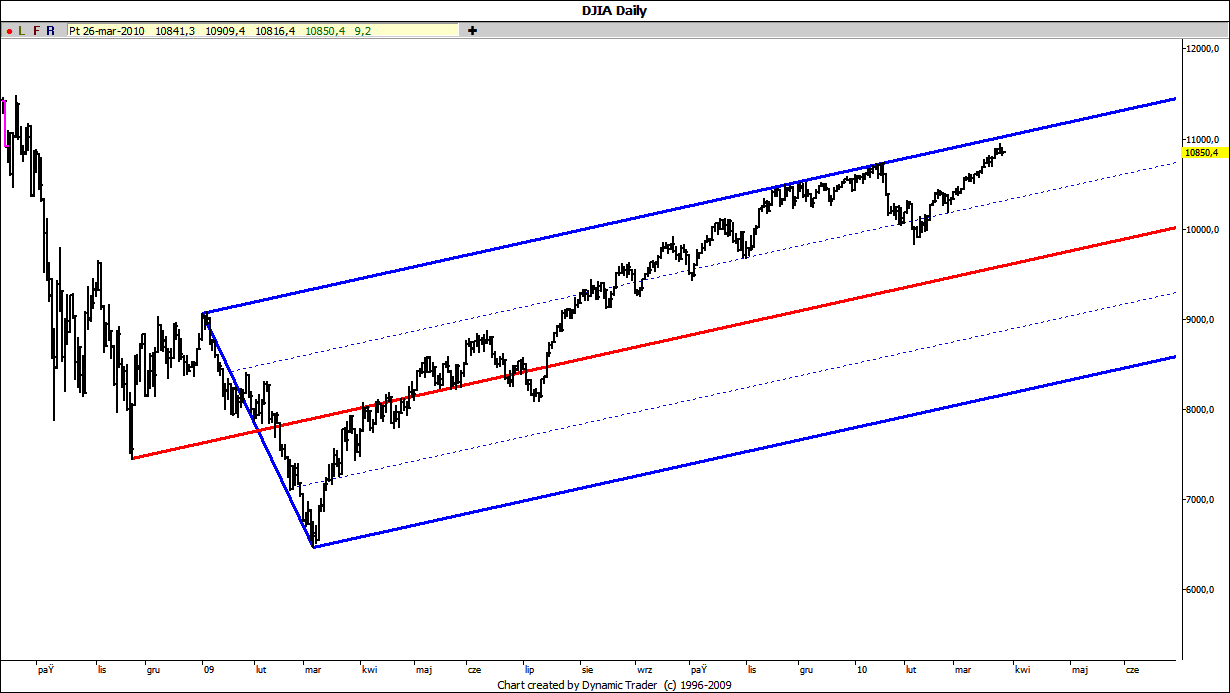
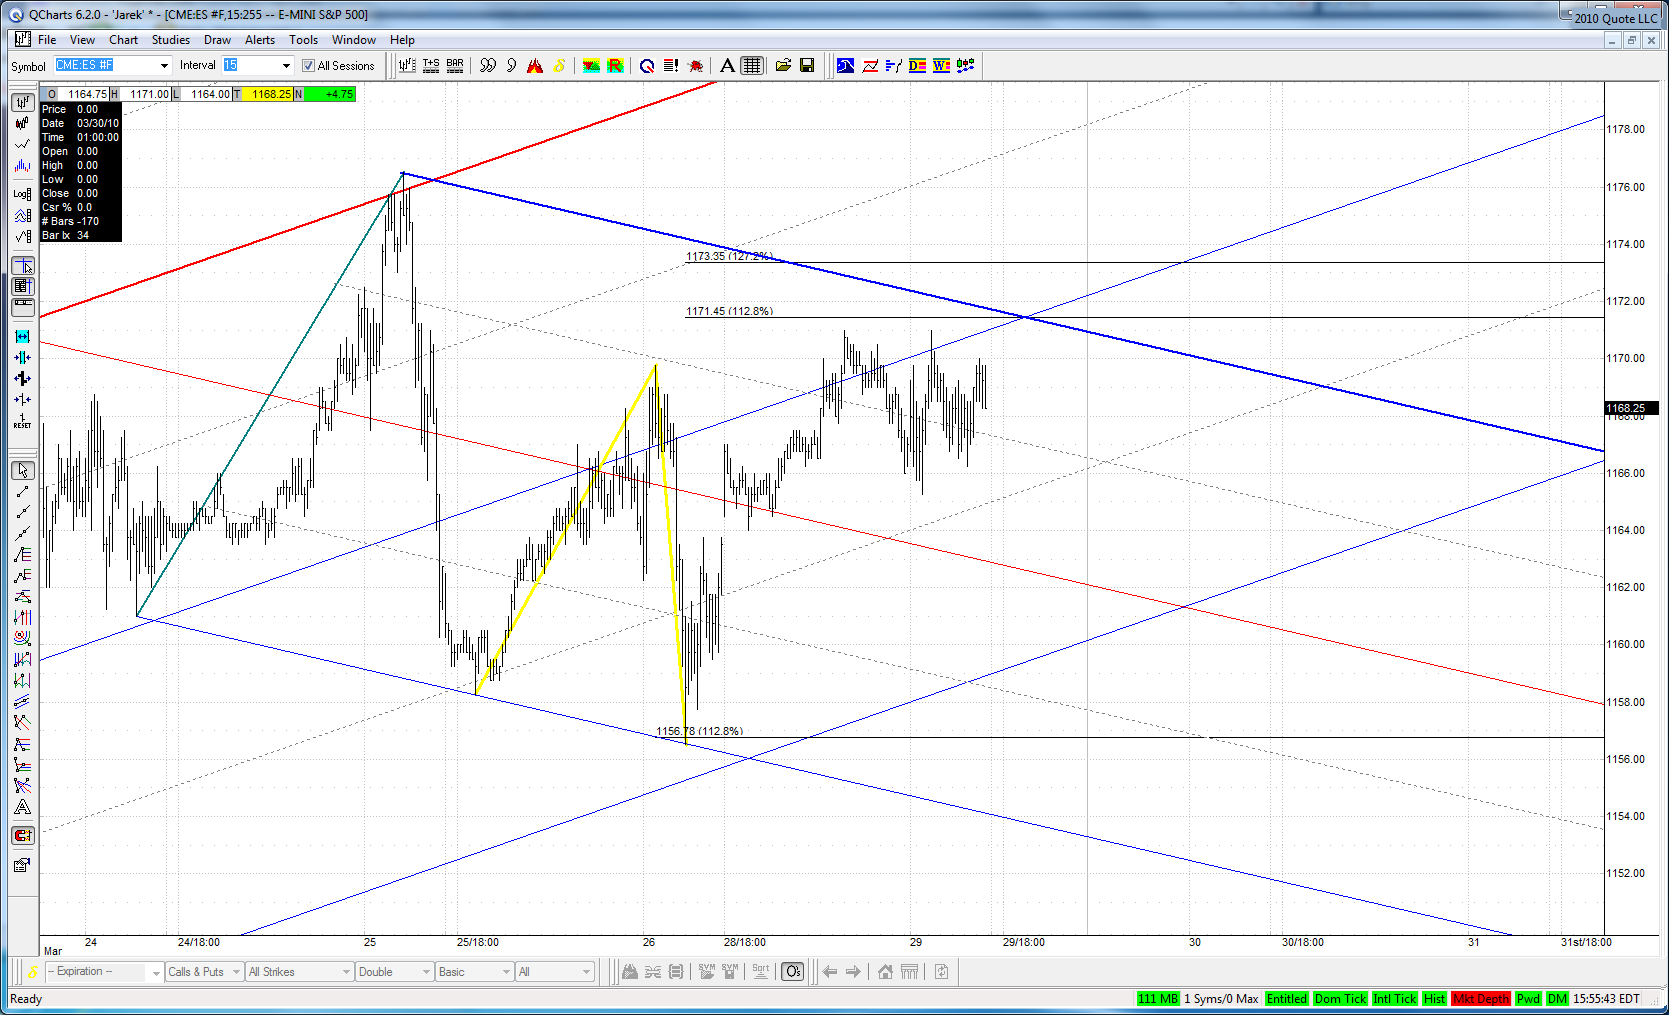
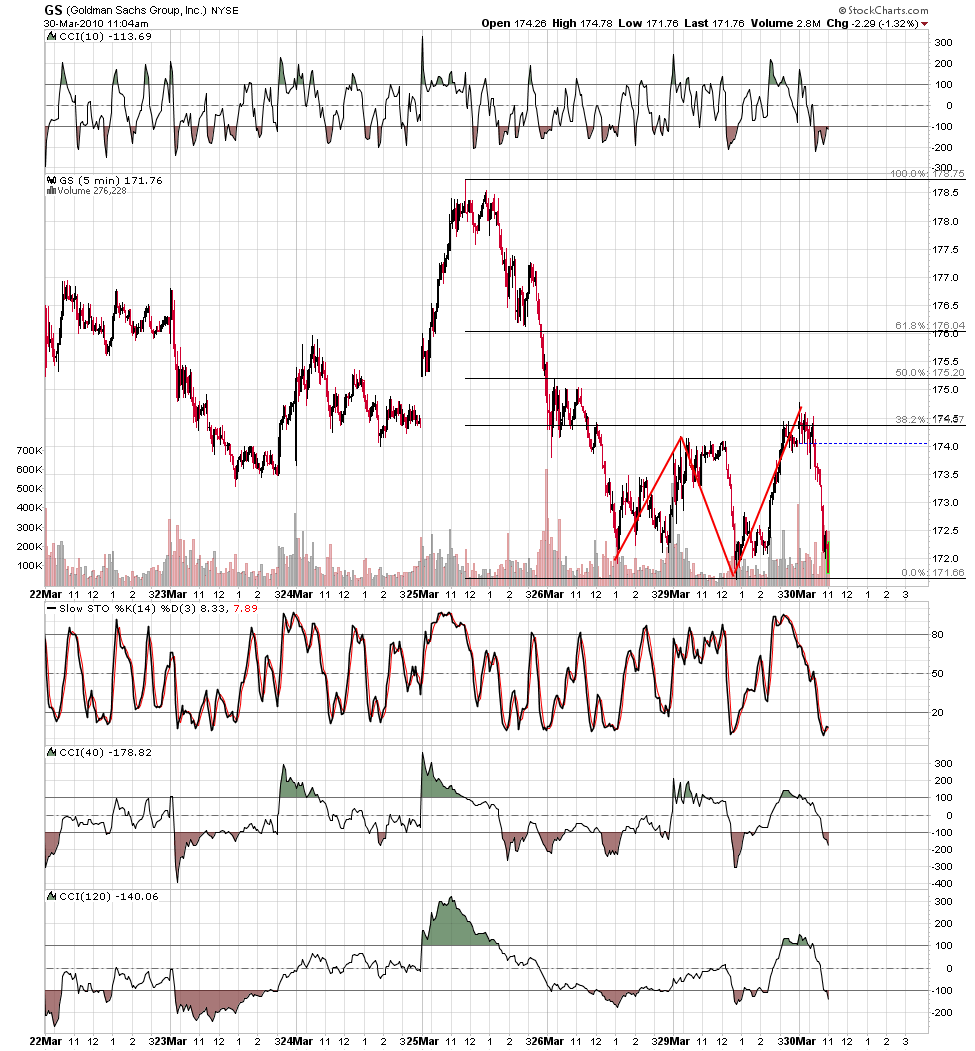
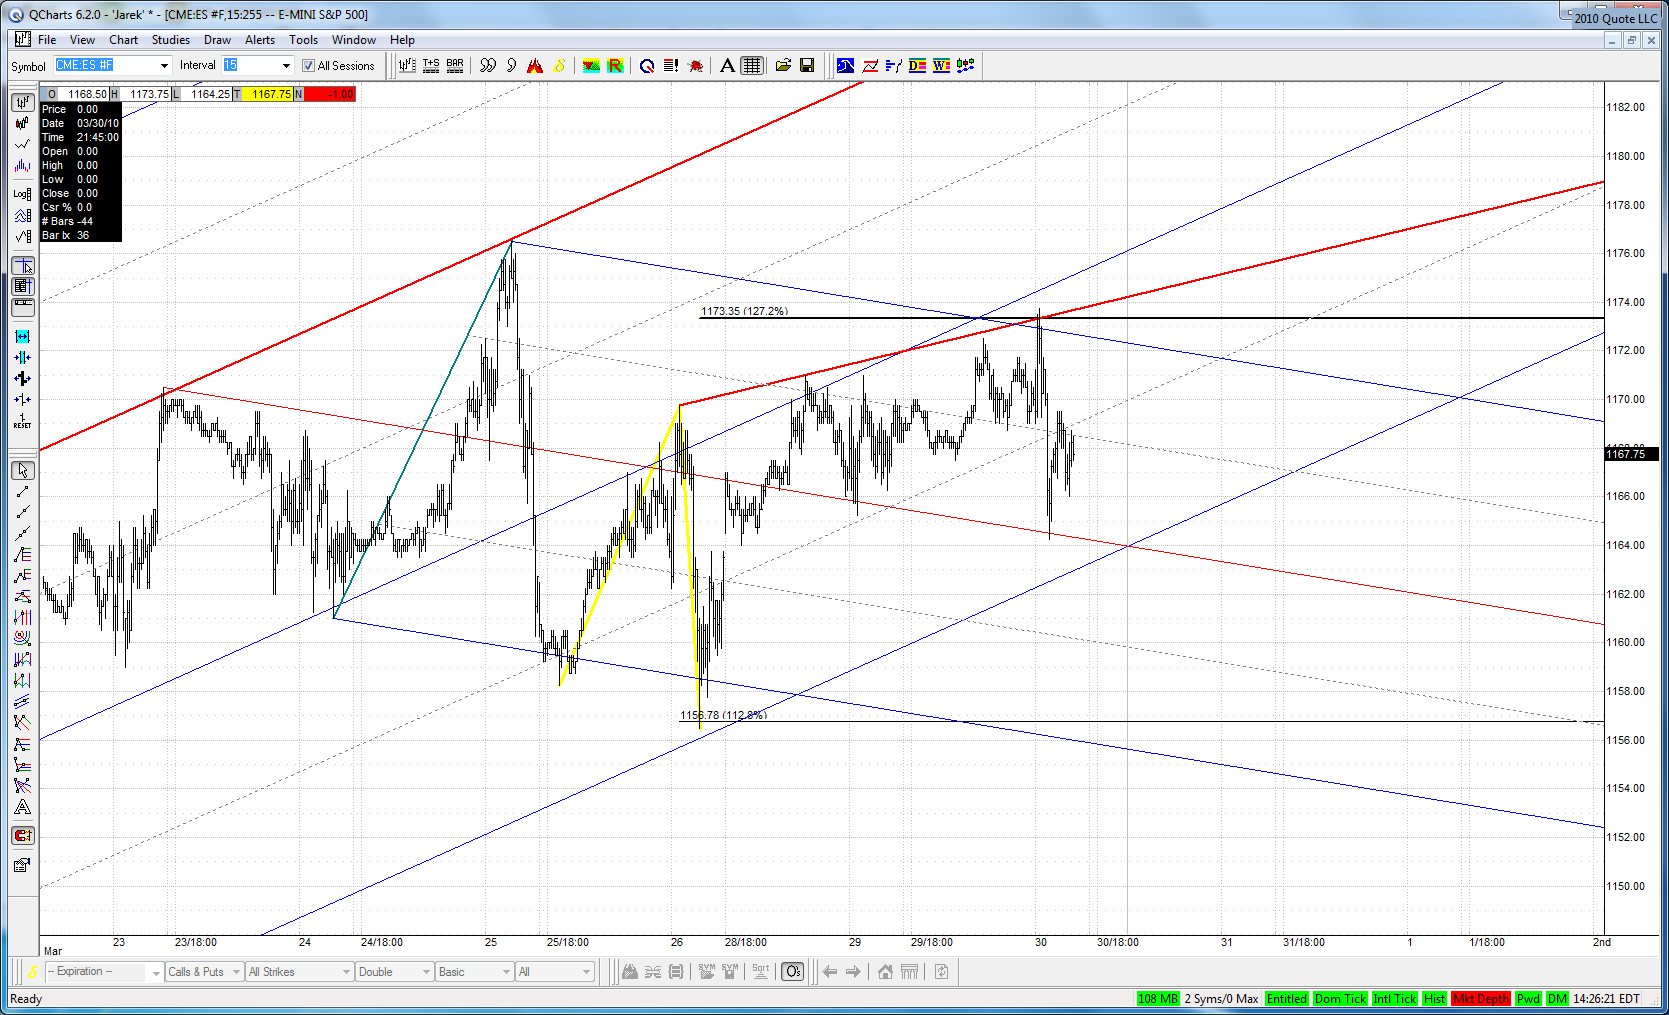
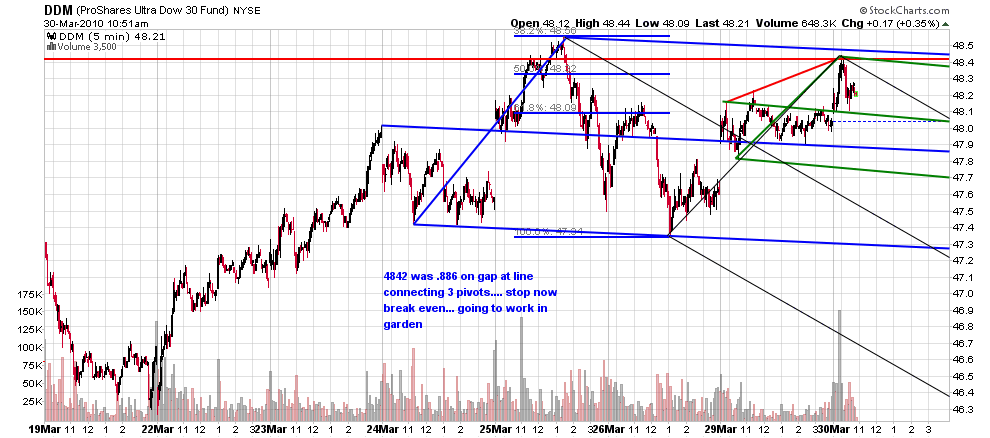
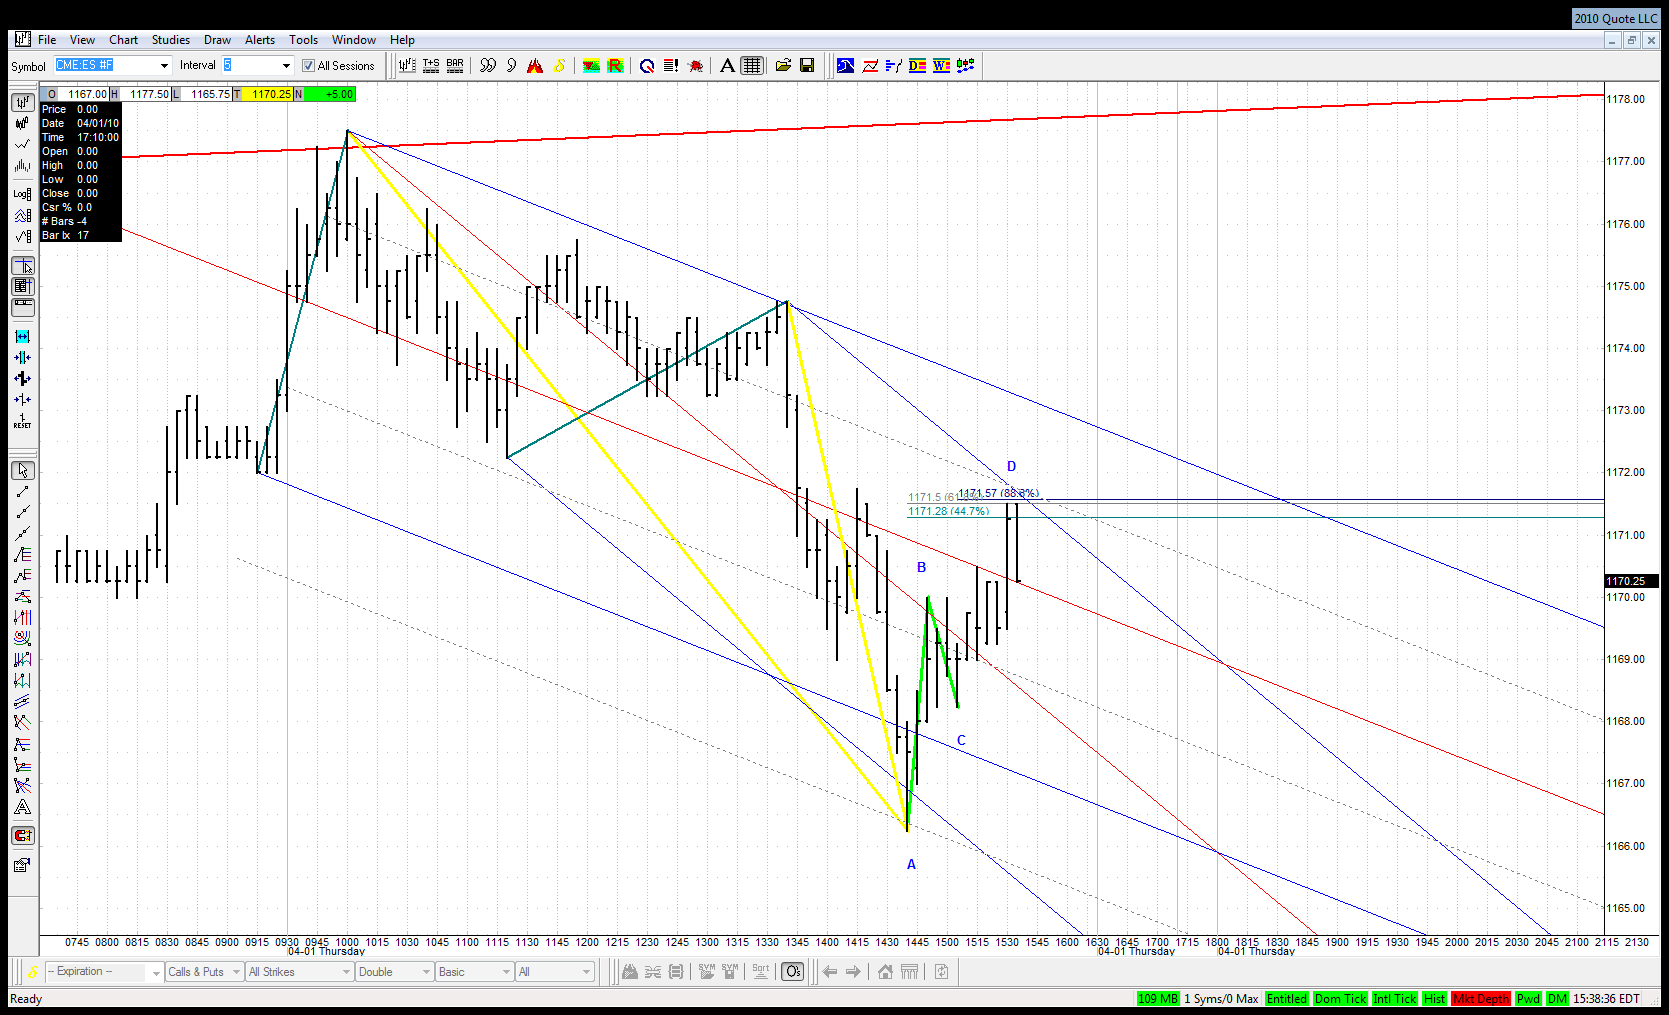
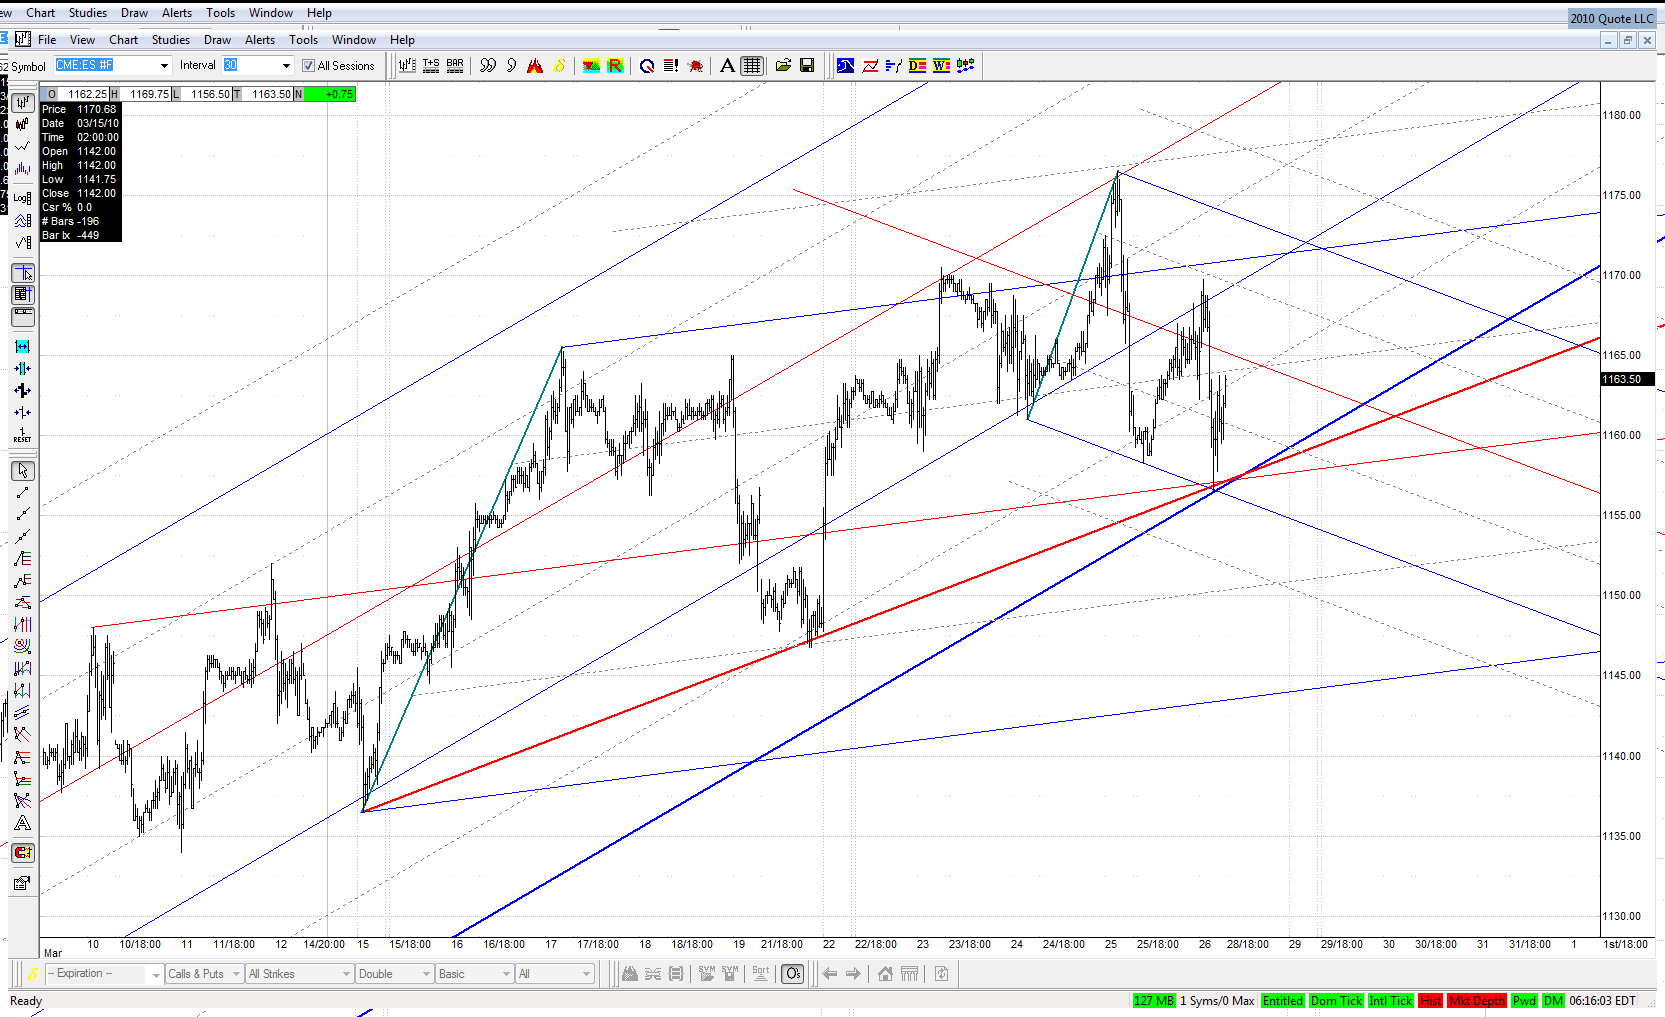
Here is a close up look at my longer term ES chart with a natural set added, showing one more time the importance of the Friday low:
Failure to keep it would most probably mean that a larger corrective move off that upper MLs has already started:
JA
jarek
Rep: 94
Posts: 3,474
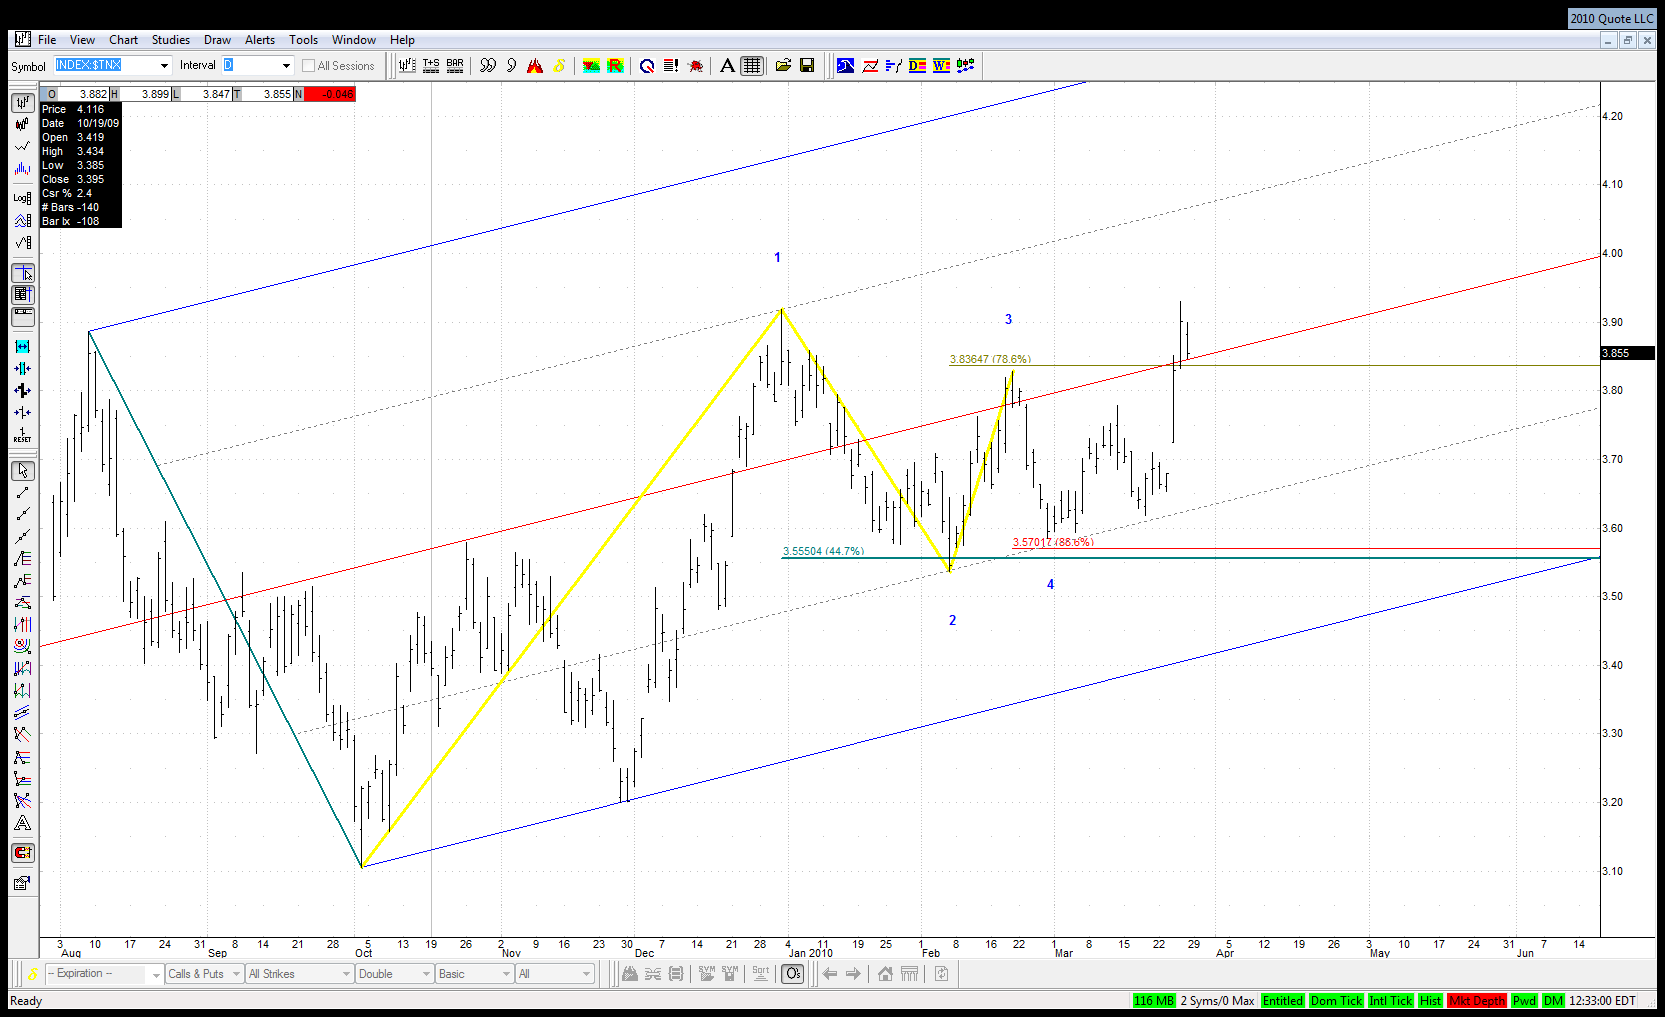
Especially when we have an interesting development in rates:
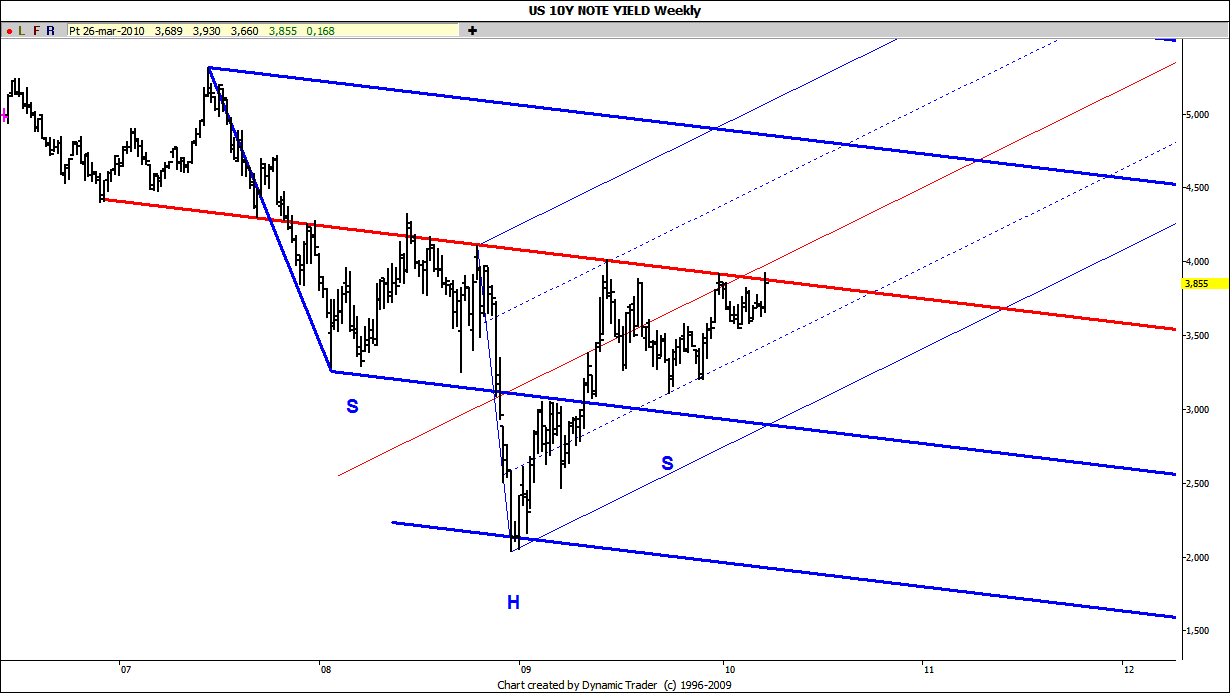
The February ABCD turned out to be a 23 leg (I'm not sure if I can call it like this) of a classic 4PT and yields are now in a Wave 3 of the move off that pattern. It quickly approached the neckline of this long term inverted H&S pattern I showed here in December:
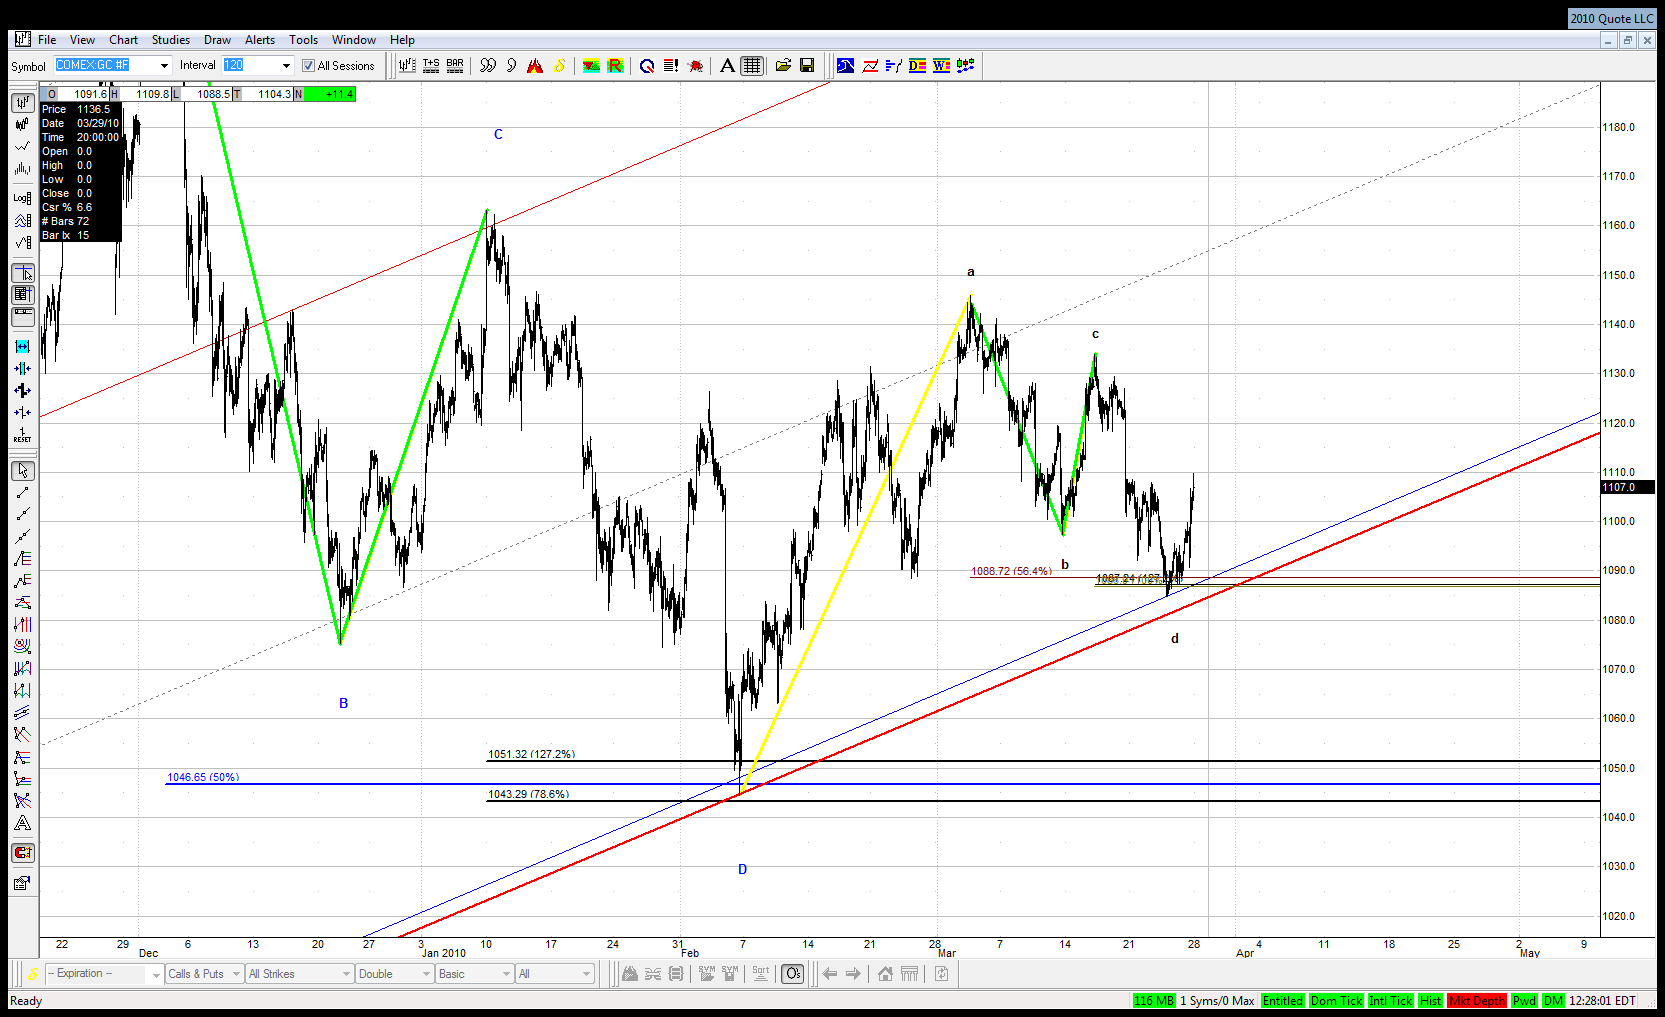
Will it break it successfully this time around? Hard to conceive both rates and gold rising substantially from here, so probably one of the 2 patterns will have to fail. The question is which one ...
JI
jimkane
Rep: 3,058
Posts: 33,089
Great chartwork, jarek. Here's an article that covers a lot of the same things. Not with the KT flare, of course, but with similar conclusions.
http://www.zerohedge.com/article/stock-market-barometer-weekly-report-blowing-wind
BTW, I think gold and rates can go up together, as bizarre as that seems. (Besides, for one logical viewpoint, rates going up signifies inflation. Inflation means you want gold.) We can have these odd intermarket dynamics, I think, because the entire market is not free, and big, hot money flows and manipulations rule the day. The key is to see what the current correlations are, not what the sensible correlations are.
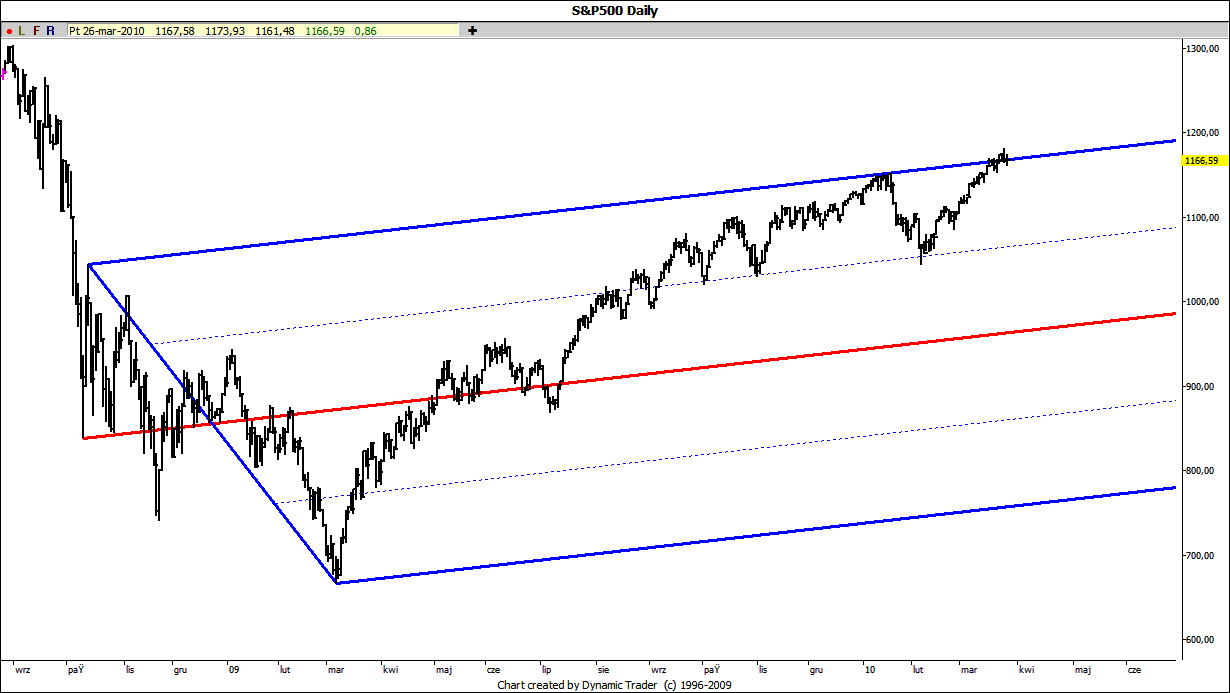
Recall way back when the correlation between the USD and the market was almost fully -1.0000. I said when the dollar starts to rally the market won't go down like everyone says, instead the correlation will likely just break. And the dollar went up and the market just kept going up, exactly as I suspected. Point is, I wasn't married to the correlation, I was watching what the market told me the current correlation was.
http://www.zerohedge.com/article/stock-market-barometer-weekly-report-blowing-wind
BTW, I think gold and rates can go up together, as bizarre as that seems. (Besides, for one logical viewpoint, rates going up signifies inflation. Inflation means you want gold.) We can have these odd intermarket dynamics, I think, because the entire market is not free, and big, hot money flows and manipulations rule the day. The key is to see what the current correlations are, not what the sensible correlations are.
Recall way back when the correlation between the USD and the market was almost fully -1.0000. I said when the dollar starts to rally the market won't go down like everyone says, instead the correlation will likely just break. And the dollar went up and the market just kept going up, exactly as I suspected. Point is, I wasn't married to the correlation, I was watching what the market told me the current correlation was.
JA
jarek
Rep: 94
Posts: 3,474
I guess Jim wants to check how this forum would look like without his daily participation :-)
JI
jimkane
Rep: 3,058
Posts: 33,089
There's a second natural set upper // at that HOD, too, jarek.
As far as participation, sometimes I get tired of just doing endless comments on my own, so I just sit and watch for awhile.
If this long gets any steam going into the close my key areas are in the 76-78 area. If you do the work you can pinpoint the spots in there quite easily.
As far as participation, sometimes I get tired of just doing endless comments on my own, so I just sit and watch for awhile.
If this long gets any steam going into the close my key areas are in the 76-78 area. If you do the work you can pinpoint the spots in there quite easily.