MyPivots
Sign In
JA
jarek
Rep: 94
Posts: 3,474
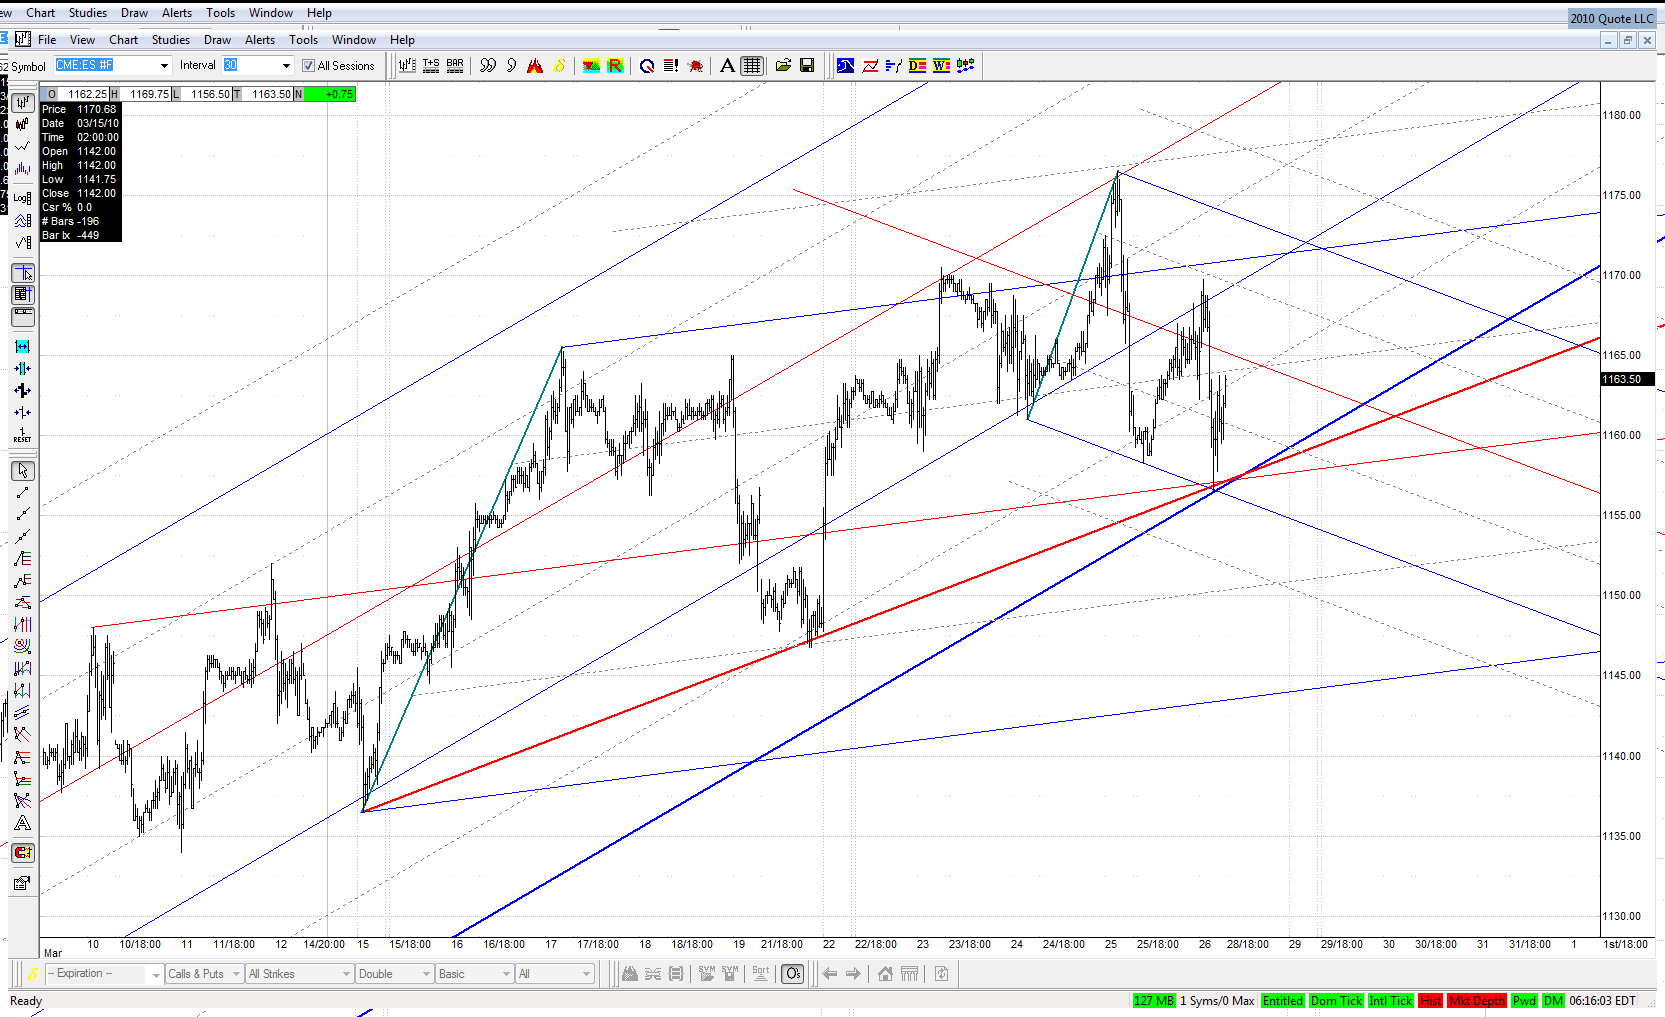
Here is a close up look at my longer term ES chart with a natural set added, showing one more time the importance of the Friday low:


Click image for original size

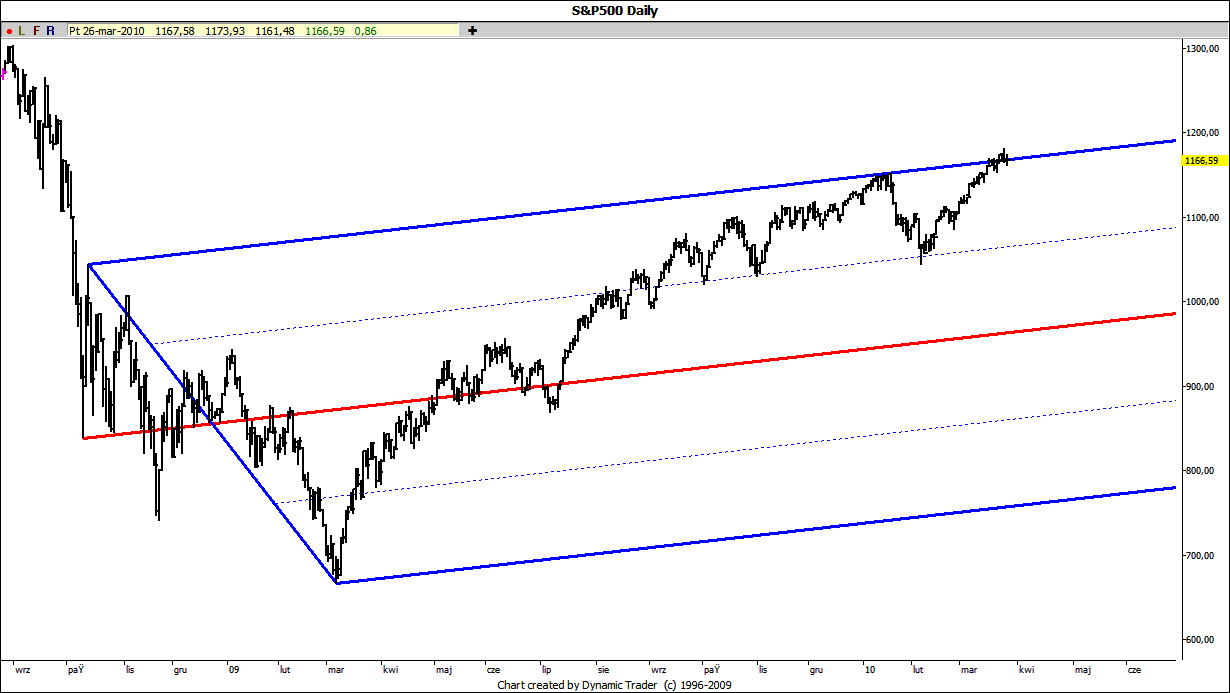
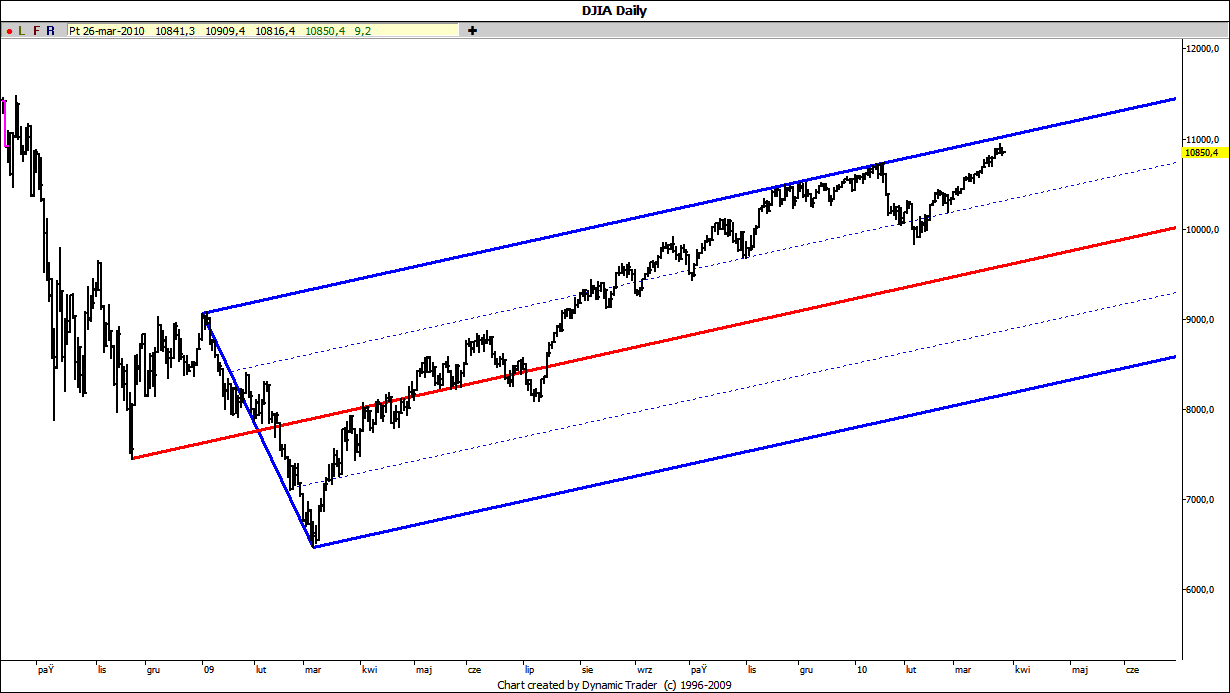
Failure to keep it would most probably mean that a larger corrective move off that upper MLs has already started:


Click image for original size

Click image for original size
JI
jimkane
Rep: 3,058
Posts: 33,089
Clue time. .300, little ABCD, at a line, and it sure 'sees' it.
JA
jarek
Rep: 94
Posts: 3,474
So the little bearish abcd overcame the bigger bullish ABCD. We now know what is the direction, at least in the short term.
JI
jimkane
Rep: 3,058
Posts: 33,089
Exactly. Like I said, I'd be surprised if it didn't sell more, and it did.
JI
jimkane
Rep: 3,058
Posts: 33,089
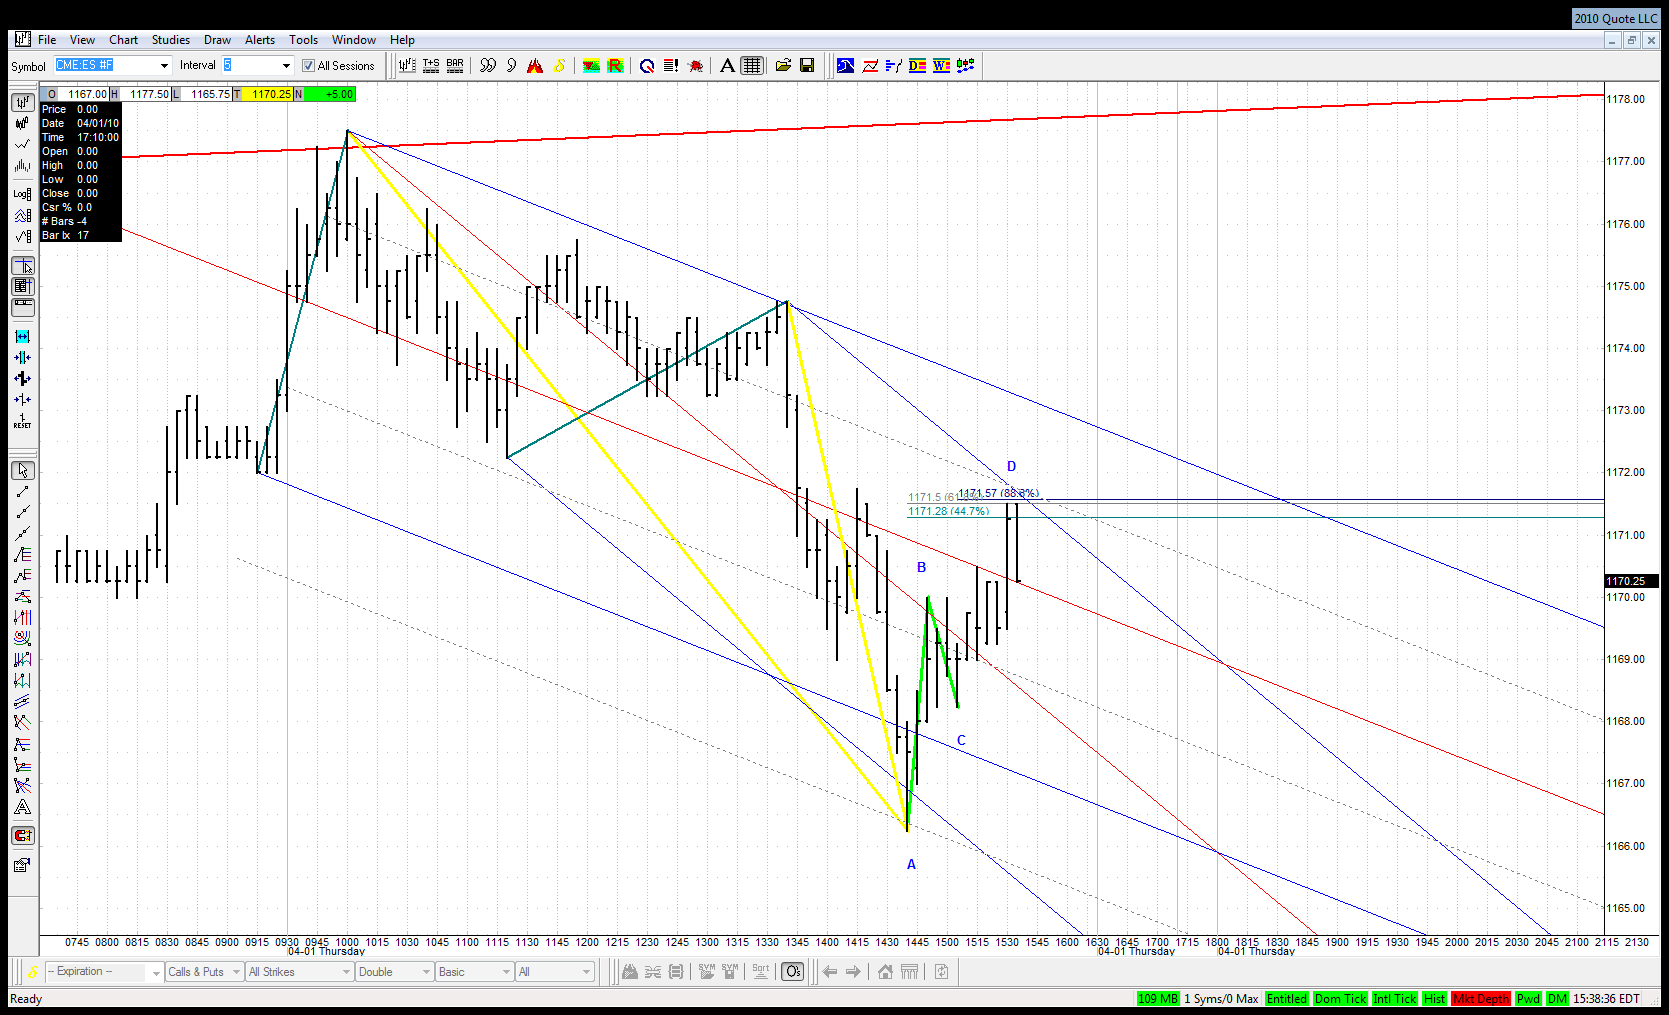
Just be aware of the 3-4-5 look to this, and the next area, which is right here. I just watch areas as they are hit to see what it does with them. It sure looks like they want to visciously sell it.
TO
tomo
Rep: 110
Posts: 238
Originally posted by jimkane

Just be aware of the 3-4-5 look to this, and the next area, which is right here. I just watch areas as they are hit to see what it does with them. It sure looks like they want to visciously sell it.


Sorry but what is 3-4-5 ? Did not find it in terminology post.
JI
jimkane
Rep: 3,058
Posts: 33,089
I just mean it looks like the end of an Elliott 5-wave sequence. Sometimes it doesn't have a nice 1-2 count to start it, but it ends like a 5-wave.

70 is a critical area here, folks, to see if this potential support area I mentioned may turn this, or just another bounce and roll.
JI
jimkane
Rep: 3,058
Posts: 33,089
There is some amazing geometry on the 1 and 3-min charts going on in here, but it is more than I could describe. If you watch those timeframes you should do a lot of work in here looking at this.
JA
jarek
Rep: 94
Posts: 3,474
Another potential ABCD:


Click image for original size


... although with 3 legs in the CD leg