ES short term trading 4/15 /10
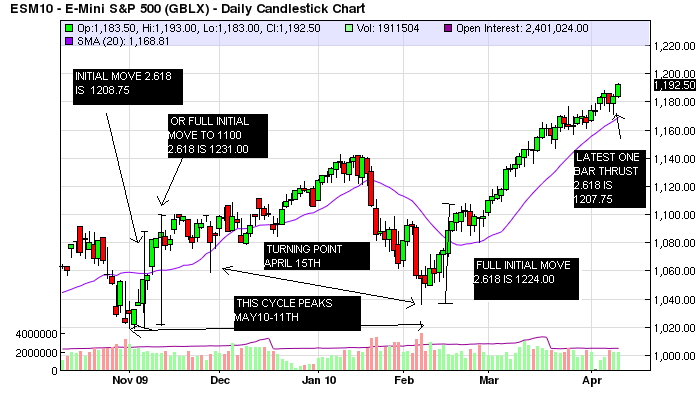
Wow, some action, huh? The power in the rally off of the Feb. low is stunning (3rd waves usually are!). New highs exploded today to 611, a new rally high. This basically means that even if we tank tonite or tomorrow, higher prices eventually are likely. Im going to reprint the chart i last showed on last weekends preview because i think it may be important, and ill try to do a brief update tomorrow morning if i can stay awake!.....
Click image for original size
Originally posted by johnpr2010
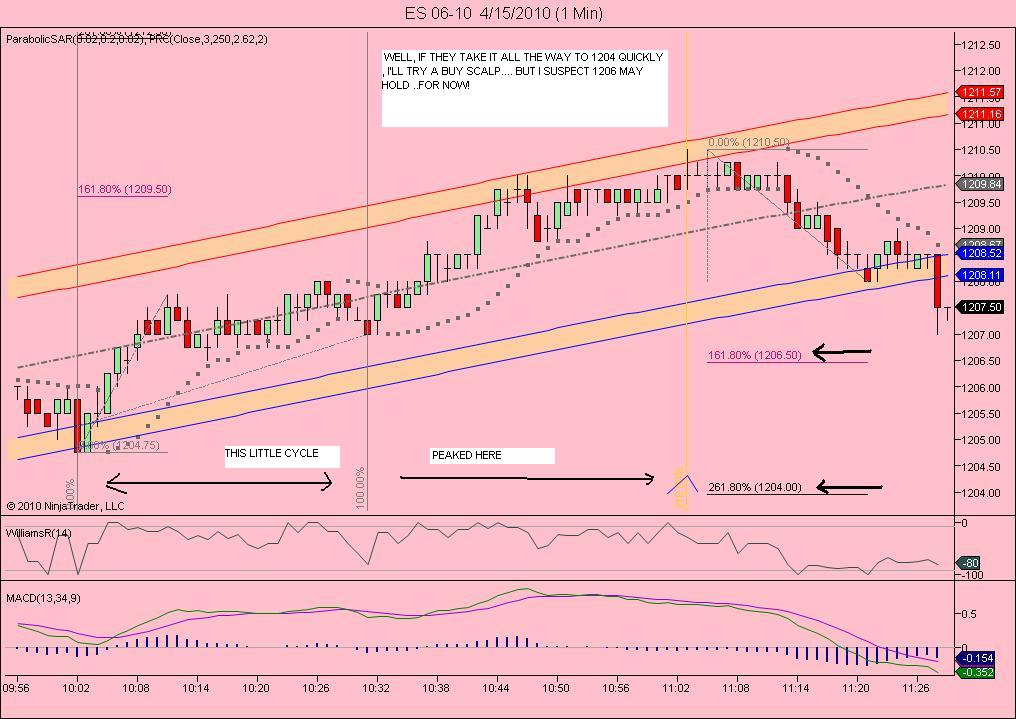
I believe that this one is not going futher the pivot resistance of 1211.00
I pull out at 1209.50 because there is a bunch of fibs in the 1210 up to 1211 plus the Pivot you just mentioned. I should have reversed but did not. Gizz!
covering here at 1208.00.. just not enough power yet on the downside yet! Back to breakeven.. yippeee!
I see a good entry level on the 50% of the fibs from RTH H/L points. I confirm this with my Bid and Ask oscillator showing a strong trend up. I would go long on 1107.75 this is where the big player are sitting to follow the trend.
I pull out at 1209.50 should had reversed but did not! There is a bunch of Fibs in the 1209/1211 area plus the pivot resistance. I should had reverse but did not. Will wait a bit for next set-up.
well, looks like sellers may have something to work with.
I'm seeing a cluster of -ve TICKs - could this be the distribution that koolblue was talking about ?
1206.5 gap fill should be acting as support for a bounce. But if this is distribution, then 1210.5 should have been HoD, bounces should be contained by 1209.75 and I expect 1206.5 to fail within the next hr.
Click image for original size
I pull out at 1209.50 should had reversed but did not! There is a bunch of Fibs in the 1209/1211 area plus the pivot resistance. I should had reverse but did not. Will wait a bit for next set-up.
BTW, nice call for 1209 Hunter ( made on your previous thread!)Good job!... I still feel theres a short term and maybe a fairly decent top forming up here somewhere!... i just dont think we shoot straight up to 1224 , but who knows? im long from 1206.50 but just for maybe 2 handles! No courage on the upside, since it is the 15th!
dam! stopped out at breakeven... going to be very cautious on long scalps today! Why o why didnt i hang on to my original short?... sigh!... watching and waiting...
Thanks Koolblue. I did get out yesterday 1/2 of my position and placed stop on the other 1/2 at 1202.75. Got taking out last night. it was a good swing trade from 1172.50.
The reason i started to pull out was because it was very close to the objective and I do have a small Fib. time cycle for today also. No worth to risk the position just for 2 more points. As you can see today, I was a good move....Thank God!
Will see my friends. the down side is near, I think. 1207.00 S/R should be a good place to keep in mind for shorts. I will wait just a bit for my set ups to show up.
I'm glad I found this forum, you guys are right on!
Originally posted by i1hunter
I think that it has one more leg up. In the 2 min. chart I can count 3w and right now working on the 4? a.b.c.d.e? if so then the 5w should be up to the 1114. will see.
The 2m. chart did the a,b,c,d,e and the 5w but it was very, very small 5w. I thought the 5w will subdivide.
One thing that bothered me was that the 2m. stochastic was not even in a low cycle (oversold) at the end of "e" and the 10m. stochastic was still on a high cycle or in the overbought area. If I was expecting a meaningful move, then the two stochastics should have been in the oversold area.
I hope this is some what clear.
Great work from everyone here. Thanks for sharing your way of seeing.
Emini Day Trading /
Daily Notes /
Forecast /
Economic Events /
Search /
Terms and Conditions /
Disclaimer /
Books /
Online Books /
Site Map /
Contact /
Privacy Policy /
Links /
About /
Day Trading Forum /
Investment Calculators /
Pivot Point Calculator /
Market Profile Generator /
Fibonacci Calculator /
Mailing List /
Advertise Here /
Articles /
Financial Terms /
Brokers /
Software /
Holidays /
Stock Split Calendar /
Mortgage Calculator /
Donate
Copyright © 2004-2023, MyPivots. All rights reserved.
Copyright © 2004-2023, MyPivots. All rights reserved.