ES Short Term Trading 4/19/10
Here's my Price Action S/R levels in Red with minor ones in Magenta. It's on a 30min bar ES chart. Sunday night's mkt just opened when I snapped the screenshot. Also, there's an upward sloping trendline in Cyan fwiw.
Click image for original size
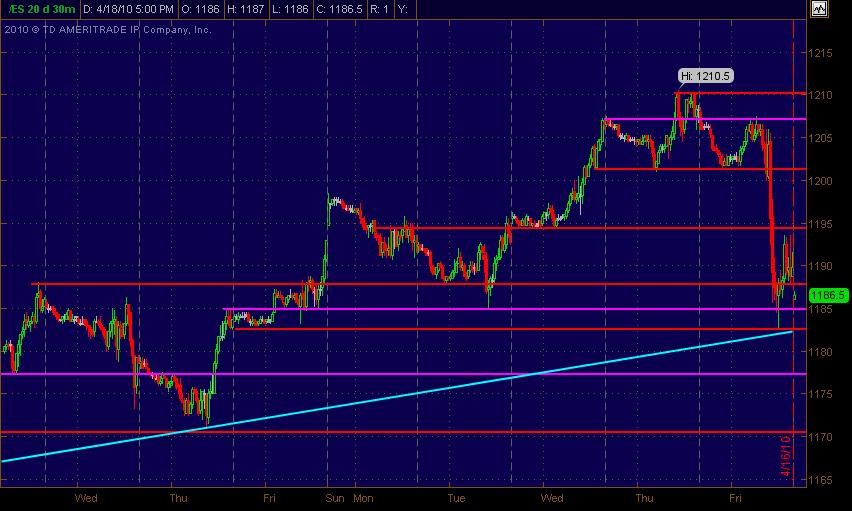
OTHERWISE, HELLO, 1186.25
Originally posted by koolblue
OTHERWISE, HELLO, 1186.25
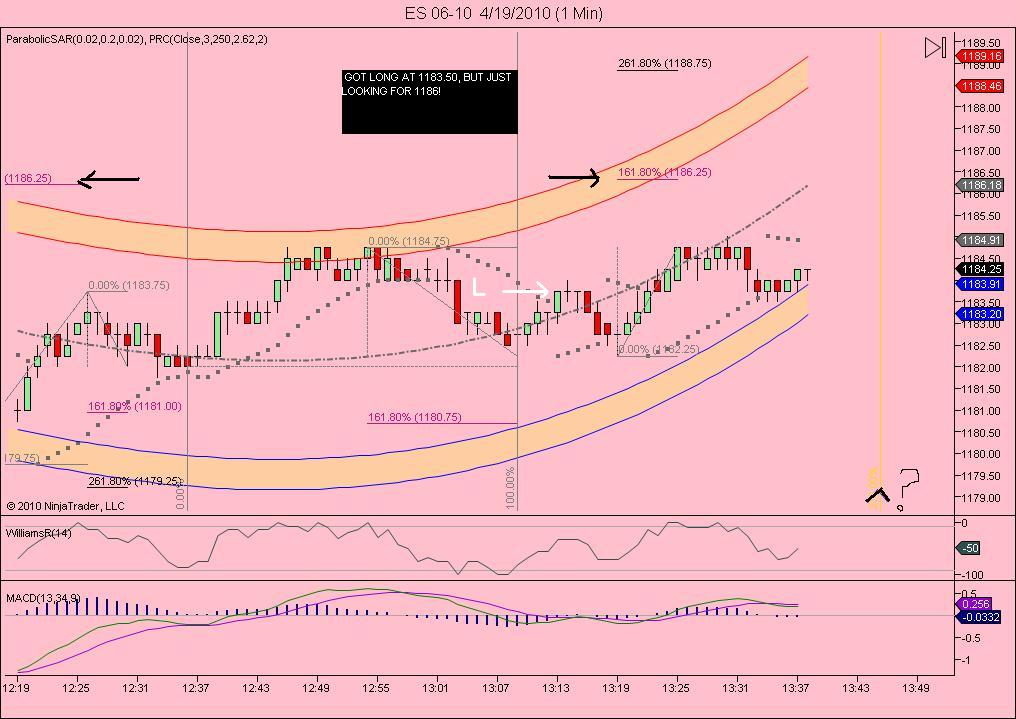
Ah! U r looking at 50% ret. It could be. 13:20 @ 1186/1187.....
Click image for original size
I dont use fib retracements, Hunter.... but maybe i should!..lol... theres your .382 retrace at 1185
Thanks Koolblue.
The price is currently under a diagonal trend line seeing in the 60m day session chart. Then
there is that 1185 horizontal resistance and the market is at 1183.75 as I type. Will see if it is able to overcome it. If not then down we go. Resistance and stops above 1185.00
The price is currently under a diagonal trend line seeing in the 60m day session chart. Then
there is that 1185 horizontal resistance and the market is at 1183.75 as I type. Will see if it is able to overcome it. If not then down we go. Resistance and stops above 1185.00
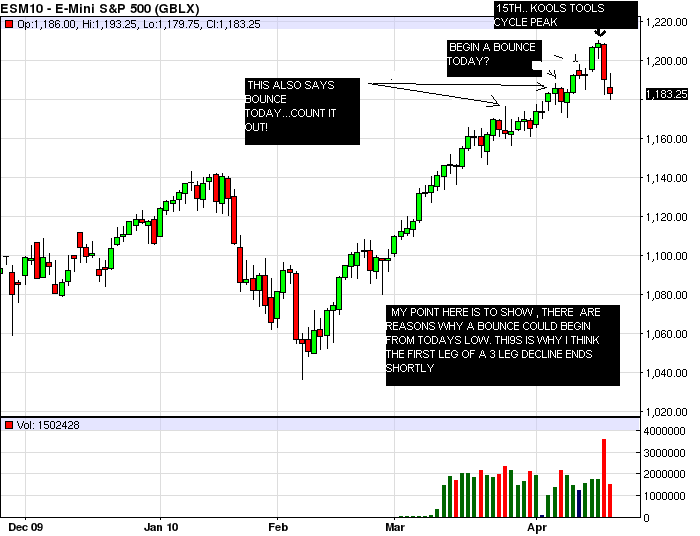
man, retail selling is strong at minus 20,000... but the big boyz are suspisiously posive 3,000! they simply are not selling this decline today! Bodes well for later and tomorrow, maybe.
KOOL, nice call on calling the top around the 15th u nailed it. thanks Rich
Very short term turning point of some sort coming in about 10 min!
Click image for original size
Click image for original size
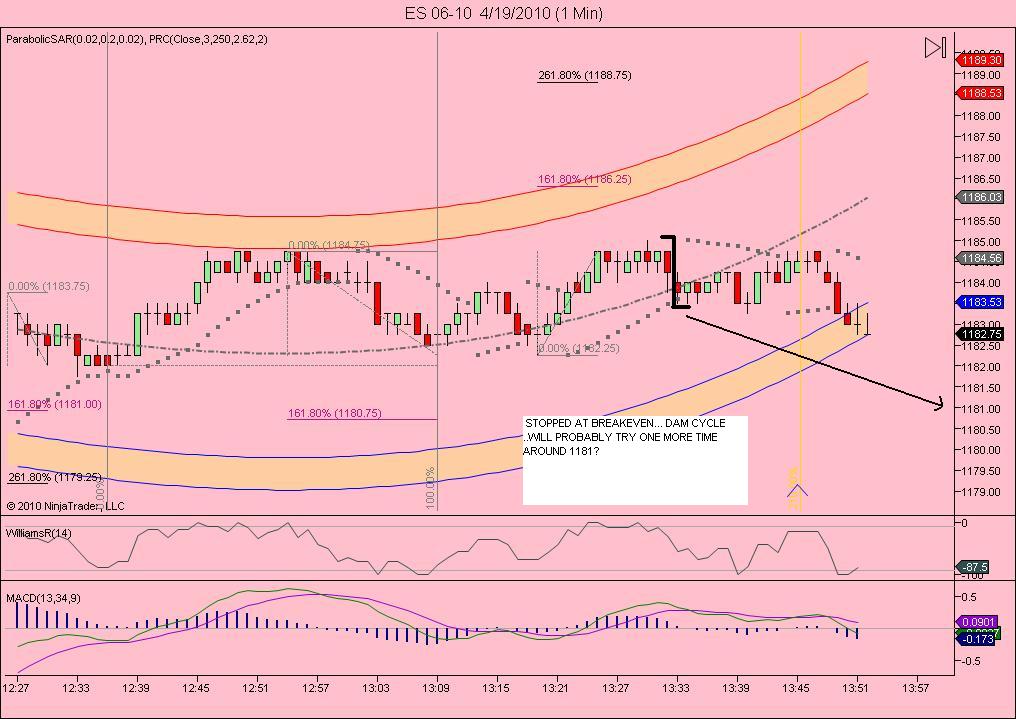
..praying that my original 1179 projection was 'satisfied ' by the 1179.75 low... but its a crapshoot!
Thanks for the link pt_emini. In case anybody wants to track this over a longer period of time I've started a topic here Mutual Fund Mondays.
Emini Day Trading /
Daily Notes /
Forecast /
Economic Events /
Search /
Terms and Conditions /
Disclaimer /
Books /
Online Books /
Site Map /
Contact /
Privacy Policy /
Links /
About /
Day Trading Forum /
Investment Calculators /
Pivot Point Calculator /
Market Profile Generator /
Fibonacci Calculator /
Mailing List /
Advertise Here /
Articles /
Financial Terms /
Brokers /
Software /
Holidays /
Stock Split Calendar /
Mortgage Calculator /
Donate
Copyright © 2004-2023, MyPivots. All rights reserved.
Copyright © 2004-2023, MyPivots. All rights reserved.