ES Short Term Trading 4/19/10
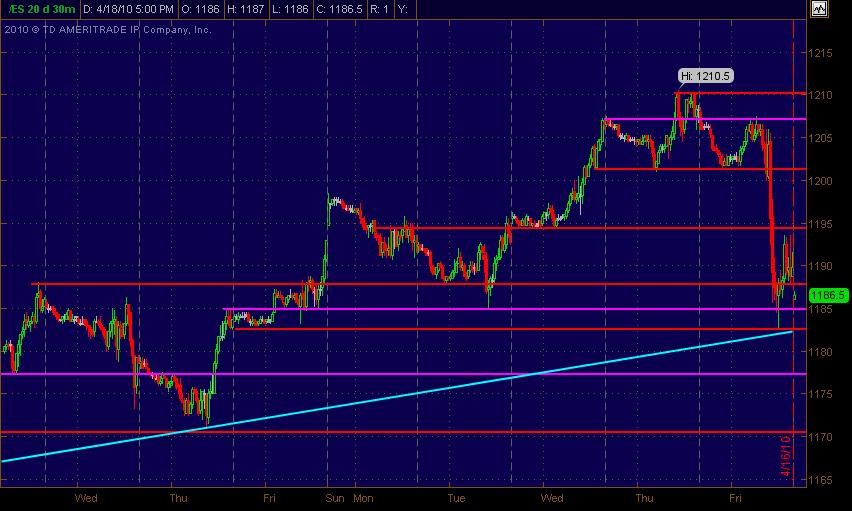
Here's my Price Action S/R levels in Red with minor ones in Magenta. It's on a 30min bar ES chart. Sunday night's mkt just opened when I snapped the screenshot. Also, there's an upward sloping trendline in Cyan fwiw.
Click image for original size
As a quick addendum follow-up ... I'd been looking at a potential and decent short swing trade that I was looking at putting on, scaling in from 1200-1210 with puts on the SPY ... ended up not doing it. Looking back, I don’t think my rationale and analysis supported a short offering a decent magnitude move down … risk was too high. I posted it on this page:
http://www.mypivots.com/Board/Topic/5593/1/short-term-trading-weekend-preview
Kool put up an insightful chart showing daily price patterns/action preceding pullbacks (or selloffs) from the past couple of months or so on this page:
http://www.mypivots.com/Board/Topic/5601/3/es-short-term-trading-4-14-2010
Yeah, the Goldman news tosses a fly in the ointment and we’re into earnings season, so right now I’m mixed. BUT, I’m surprised the market didn’t sell off further or close at the low on Friday. So, I’ve a long bias coming into Monday … or call it predisposed to potential long setups, anticipating (not predicting) some likely “buys” as long as the night session doesn’t do anything to wild and funky.
I did go through about 1500 daily equity charts on the Nyse and Naz. And this may also be adding to my upward bias ... saw a lot of strong charts with good "long" consolidation or minimal pullback patterns as well as many poised within a tad of breaking to new multi-week or multi-month highs supported by good price action during the past few days/weeks.
Just my take and am looking for all other’s analysis and chart postings.
Figured I should also post the ES Daily chart with trendlines I've got for the bigger picture.
Ain't a bunch of rocket science here on my part ... just the simple, basic and straightforward of what I see.
Click image for original size
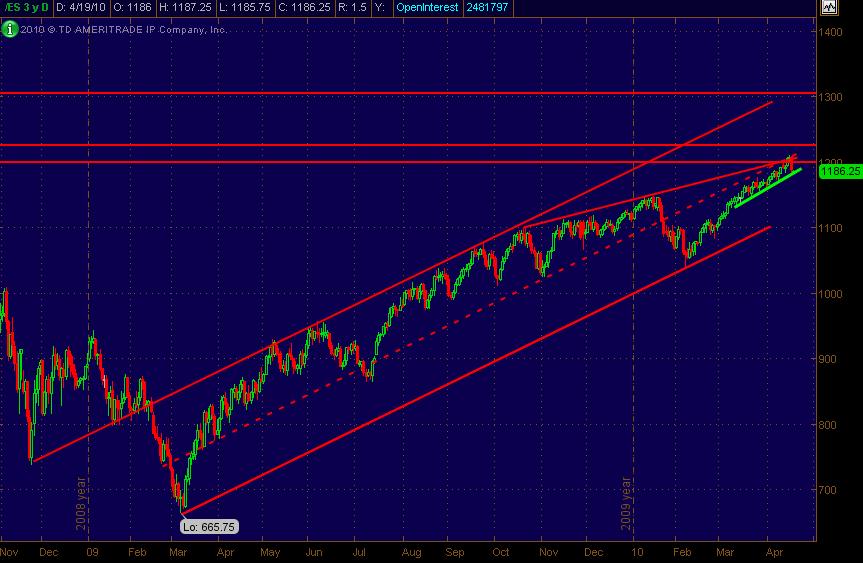
Ain't a bunch of rocket science here on my part ... just the simple, basic and straightforward of what I see.
I expect a good retracement back up. So I have some longs.
Anyone with me?
Anyone with me?
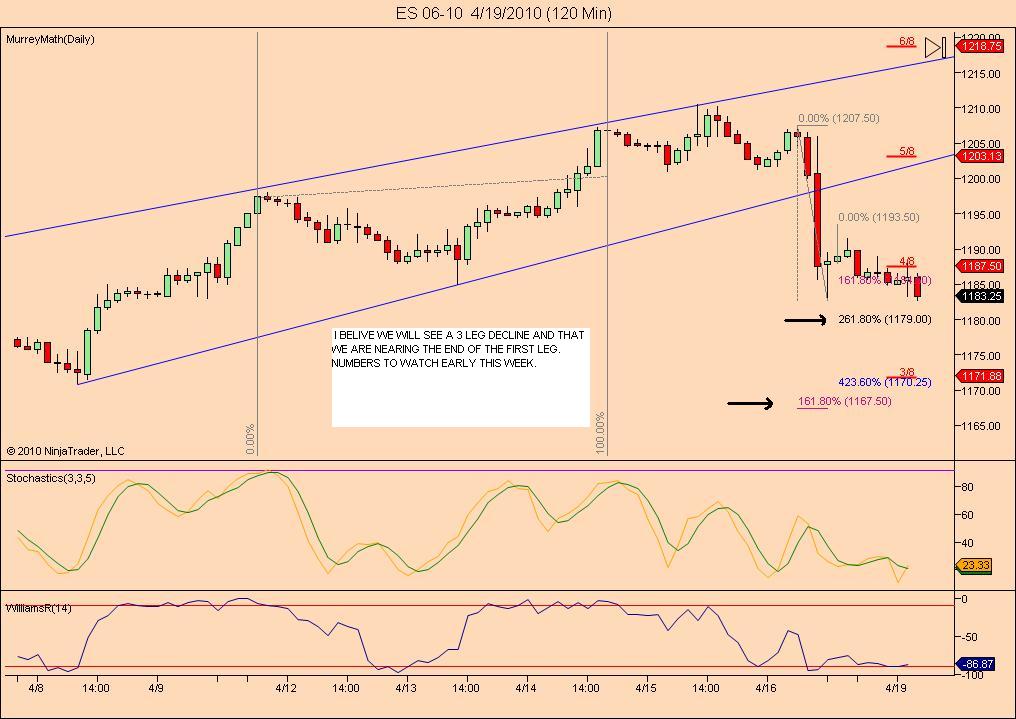
Key levels that I will be watching for a trade:
1178-79: reaction from Apr7 + 20d EMA
1183: Friday's LoD, GLOBEX reaction currently
1188-89: minor support area from Friday + VPOC + 23.6% Fib RT
1193: major resistance area from previous week and Friday + 38% Fib RT
monday's pp=1193.75, weekly pp=1194.5
Candlestick analysis says 1190.25 is the bull/bear bias line. below it, I will look mainly for shorts, above it, I will look mainly for longs.
Im looking for longs..but not till 1179.
Click image for original size
Click image for original size
Click image for original size
Koolblue, I'm too, looking for a down move and have the 1171 and 1166 as possible supports.
Will see, in due time the market will show us the way.
Thanks for the charts.
Will see, in due time the market will show us the way.
Thanks for the charts.
Originally posted by MonkeyMeat
Here's my Price Action S/R levels in Red with minor ones in Magenta. It's on a 30min bar ES chart. Sunday night's mkt just opened when I snapped the screenshot. Also, there's an upward sloping trendline in Cyan fwiw.
Click image for original size
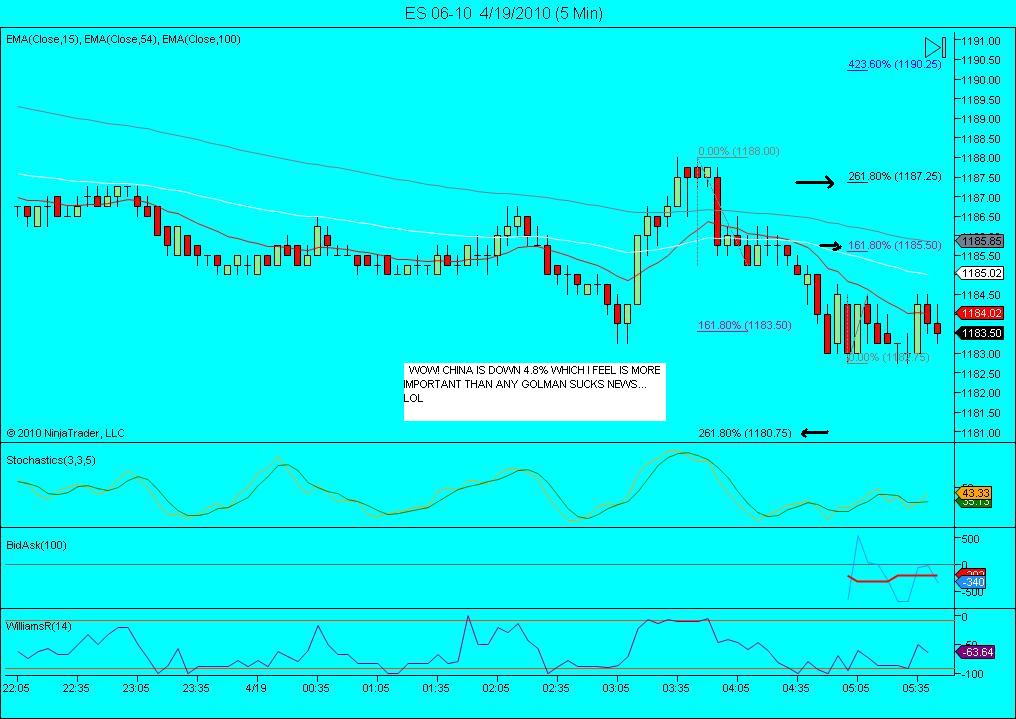
Notice that the price is testing the support trend line in your chart/ right now 08:22 E.T @ 1184.00.
Friday's low was at 1182.75, so the price is at a vary important level here. I'm looking towards the down side and possibly 1166 area by tomorrow 13:30 E.T. Will see if it plays out.
As always, in due time the market will show us the way.
Thanks for the link pt_emini. In case anybody wants to track this over a longer period of time I've started a topic here Mutual Fund Mondays.
Emini Day Trading /
Daily Notes /
Forecast /
Economic Events /
Search /
Terms and Conditions /
Disclaimer /
Books /
Online Books /
Site Map /
Contact /
Privacy Policy /
Links /
About /
Day Trading Forum /
Investment Calculators /
Pivot Point Calculator /
Market Profile Generator /
Fibonacci Calculator /
Mailing List /
Advertise Here /
Articles /
Financial Terms /
Brokers /
Software /
Holidays /
Stock Split Calendar /
Mortgage Calculator /
Donate
Copyright © 2004-2023, MyPivots. All rights reserved.
Copyright © 2004-2023, MyPivots. All rights reserved.