ES short term Trading 5-03-10
Lots of numbers in the 88 - 92 zone..Confluence of weekly and daily PV numbers and the HVP is there...The weekly has HVP at 1189...should be a good magnet for those who can find longs. Right above is low volume (94-96)off the weekly so we need to watch that area closely if/when it gets up there. I personally wouldn't favor staying long above 92 as then we start falling into the low volume air pocket of the weekly.
We have previous weekly lows, key round numbers and S1 falling in the 75 - 77 area.
1200 - 1203 is next resistance as we have key numbers, HVP and the R1 level . That will be a challenge I think to get to on MOnday.
Lets see in the morning what has happened overnight...I'd like to see lower prices O/N to set up long trades in the morning.
Good luck tomorrow everyone.
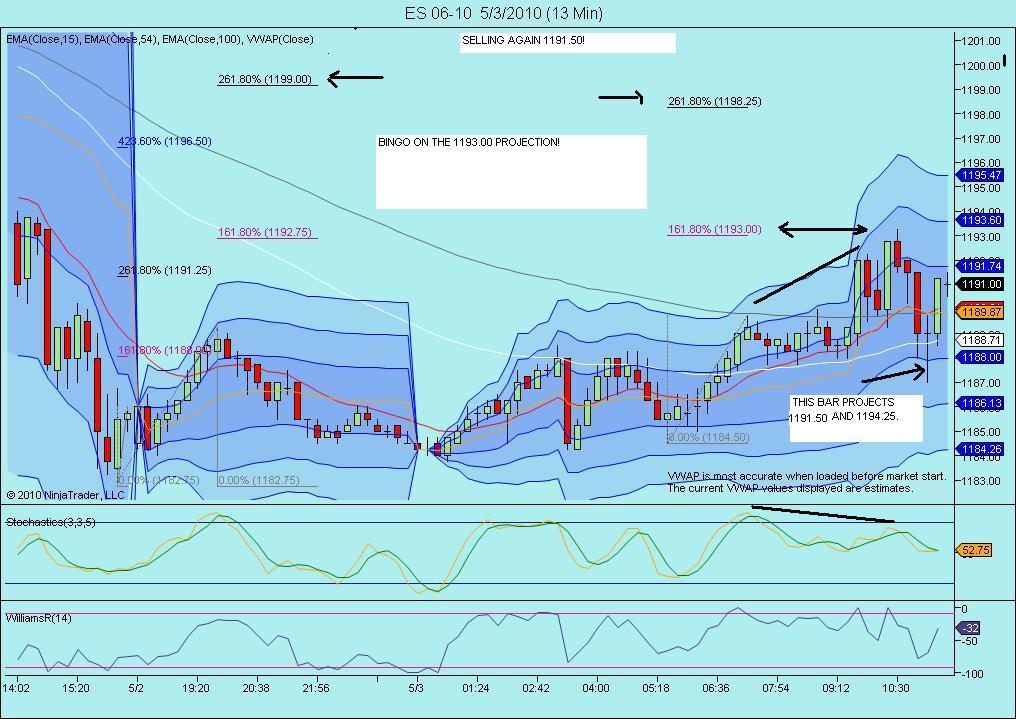
Didn't anybody sell that 1193.00 i posted?!??!? That was a vol area also!....
Click image for original size
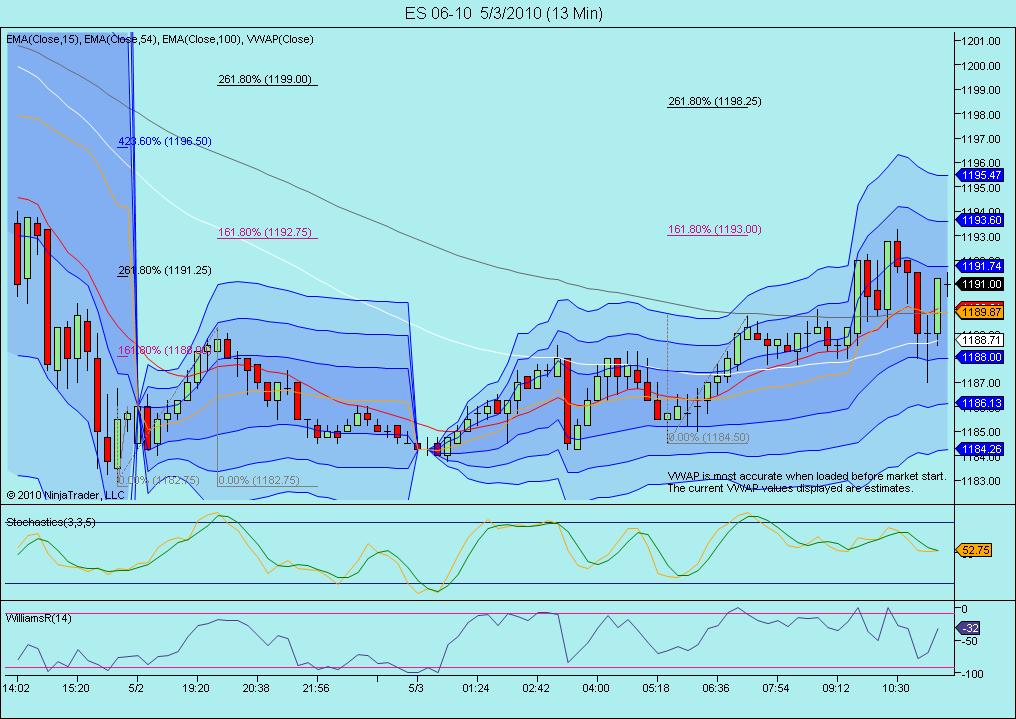
we had peak volume from overnight, the va low and the midpoint all coming in at the 86 - 88 area.....so pick one...LOL...I won't be surprised at the complete gap fill later but conflicted as they haven't tagged 94 - 96 from the weekly
Originally posted by phileo
1187 looking more and more like a reversal. Prices is back above the open now.
What was so special about 1187 ?
Click image for original size
Click image for original size
Out of my short 1192.25 loss of one handle on 2 es!...ugh.. waiting to jump in long at lower prices...
Click image for original size
i was at the 92 level, but reversed when it didn't look like it would fill the gap. i was a little skeptical that it wanted to retrace some of the "air" it left on Friday especially since it didn't push much into support.
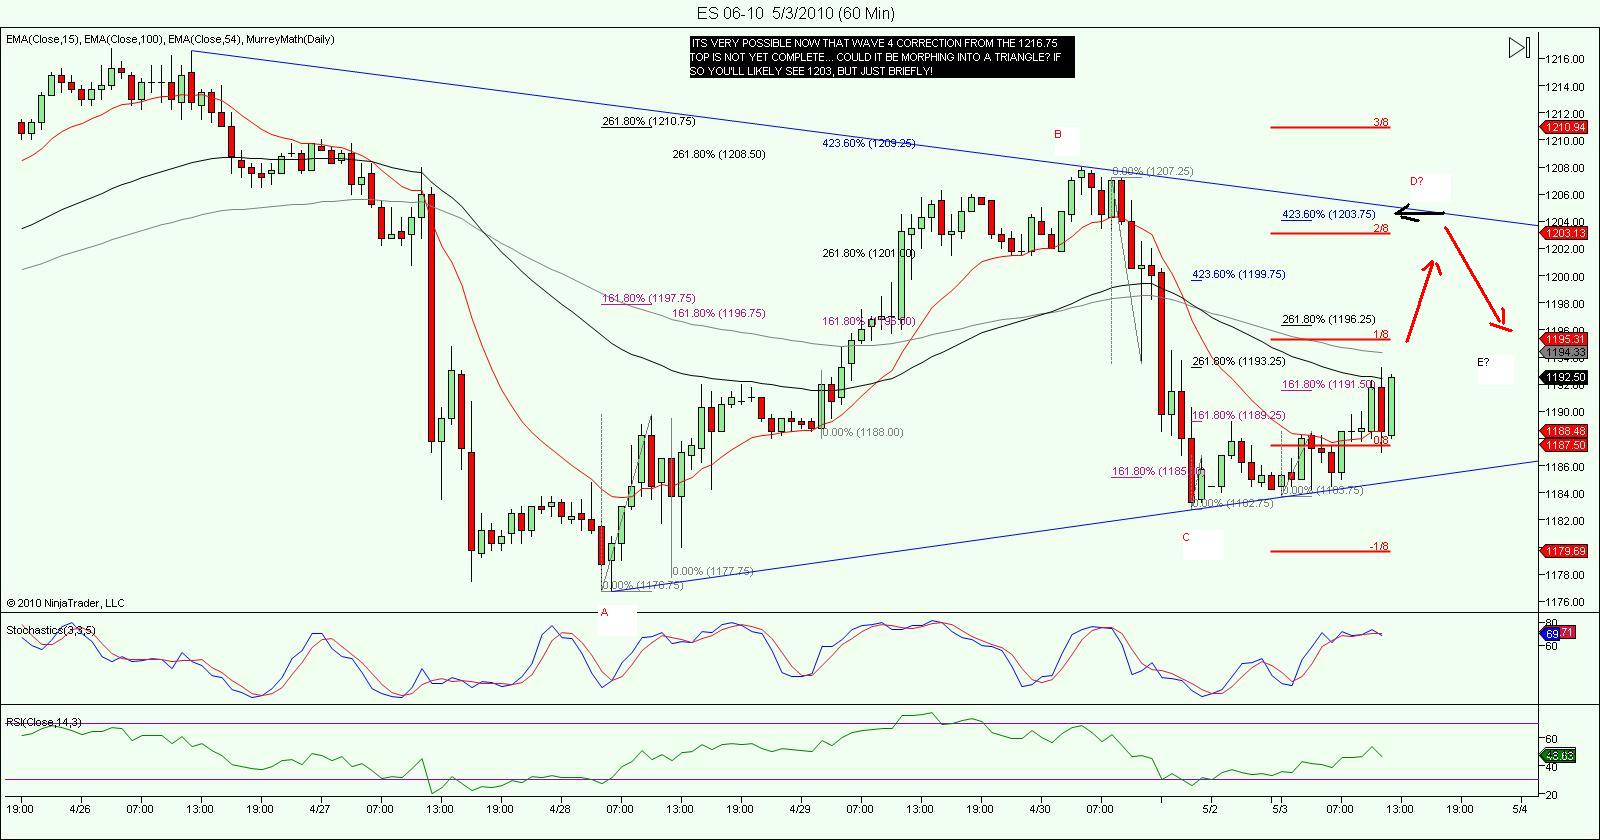
with my analysis i agree w/ your projections Kool. However, this might just make for some ugly trading in this area. nothing is very clear and it could go either direction.
However, if it can get up into that 1200 area it might look like symetrical triangle on a larger timeframe chart.
looks like there is a nice air pocket above this 94 level to the 1200.
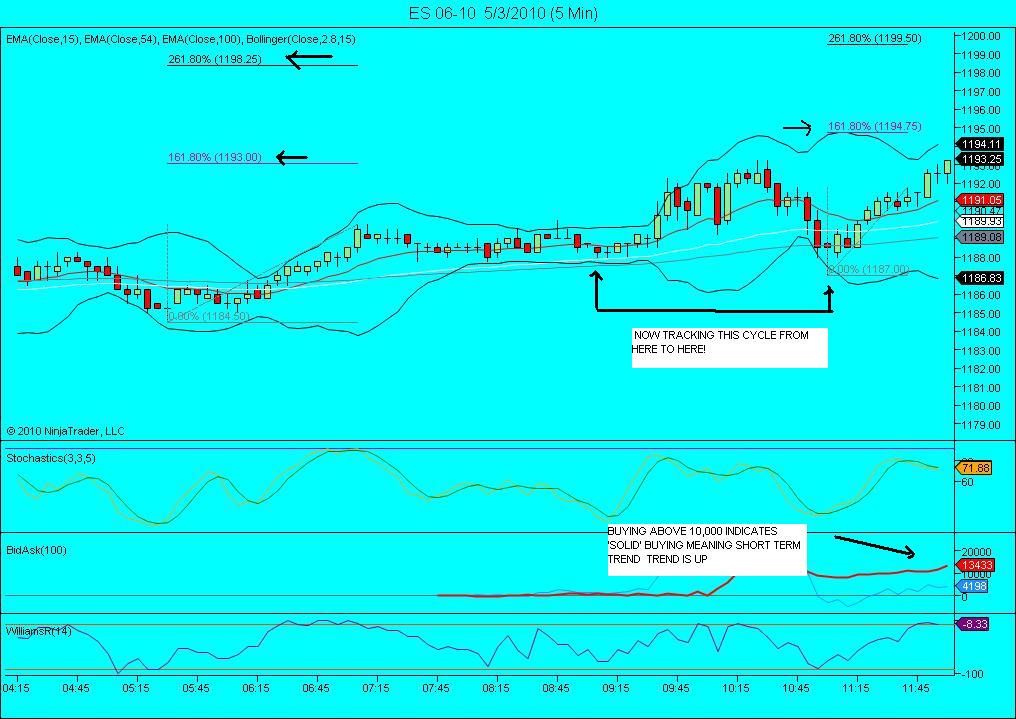
The way i analyse the above chart is notice the red and white avg's. If your bullish those will hold any retrace for continued trend up.. so thats between 1190.25 and 1191.50. That would be your buy zone. Note also ,that fornnow at least red above white above grey is of course a bullish alignment . the 13 min does not show it yet as you can see from my previous posting , but will as long as we dont spend a lot of time below 1190.
those 92 lows are toast!!
6 lows there
Originally posted by BruceM
There is no "air" there as I define it but perhaps you could elaborate...nice opening trade you took today..well done indeed.
Best air that needs to get tested is 94.25 - 95.50 from Mondays trade...the same spot I had my initial short..that's a cool zoneOriginally posted by ak1
Can they march on without touching 1192????? We have 1 tick air there.
If we take a 30 min candle chart and apply a buy or sell (given the open of the current 30 min candle) at high, low and close of a previous 30 min. candle with a 1 tick profit. Each level should be profitable. If not we have air. As the market can rally it is not advisable to do it in a live account. Run a demo account side by side to diagnose it.
Emini Day Trading /
Daily Notes /
Forecast /
Economic Events /
Search /
Terms and Conditions /
Disclaimer /
Books /
Online Books /
Site Map /
Contact /
Privacy Policy /
Links /
About /
Day Trading Forum /
Investment Calculators /
Pivot Point Calculator /
Market Profile Generator /
Fibonacci Calculator /
Mailing List /
Advertise Here /
Articles /
Financial Terms /
Brokers /
Software /
Holidays /
Stock Split Calendar /
Mortgage Calculator /
Donate
Copyright © 2004-2023, MyPivots. All rights reserved.
Copyright © 2004-2023, MyPivots. All rights reserved.