ES short term trading 5-07-10
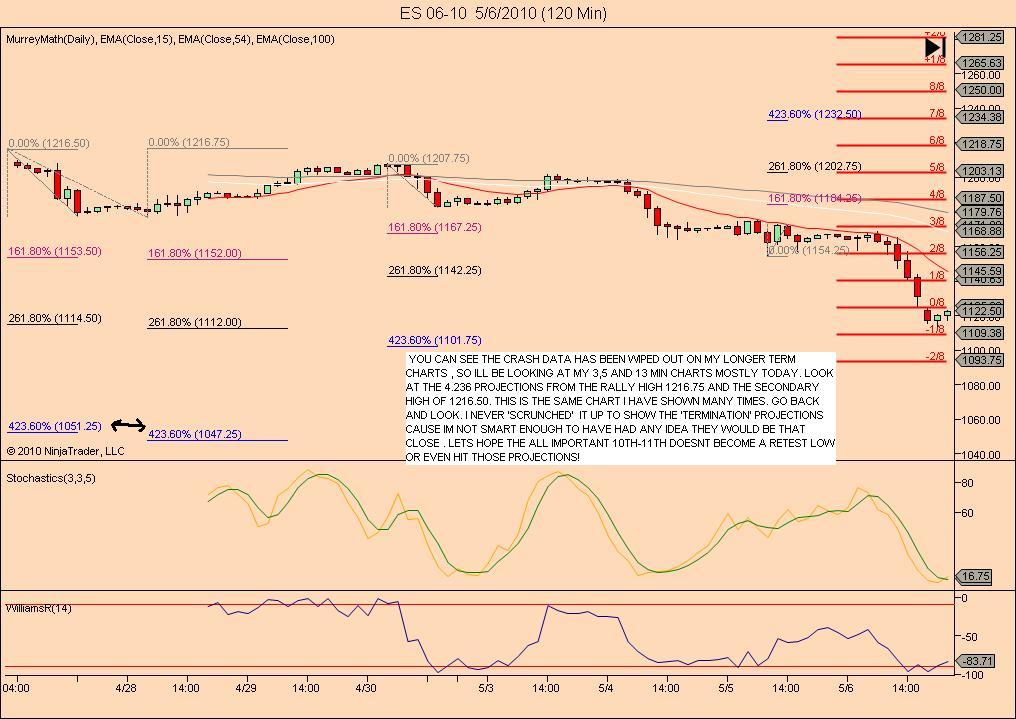
Once again a historic day. (the secular bear that started in 2000 has seen many of them!).Unlike 87,(i was trading!), unlike 98, unlike all the history made last year in a historic bear market, this crash was simply stunning. The dow plunged 1000 points not in time measured in 2 days or even all day, but in MINUTES! Welcome to the new dayz of algorithm driven robot trading! TRULY AMAZING . I didnt have many comment or posts during most of it because my charts were messing up (so i thought) and ive been around enough to know when Not to trade. I thought that was pretty much common sense, but apparently some chose otherwise. Foolish! I saw movements measured not in 1 or 2 handle increments like the 87 crash, but moves that looked like 7 or 8 handles at a time.I read one analyst who said they were closer to 20.Anyway, to the future. Like with any major earthquake, there is always the chance of small aftershocks, so please if you decide to dip your toe in the water, exercise due caution and USE PROTECTIVE STOPS!....Trust me, new highs (thats right i said new rally highs are ahead). The world isnt ending quite yet! lol
Click image for original size
Click image for original size
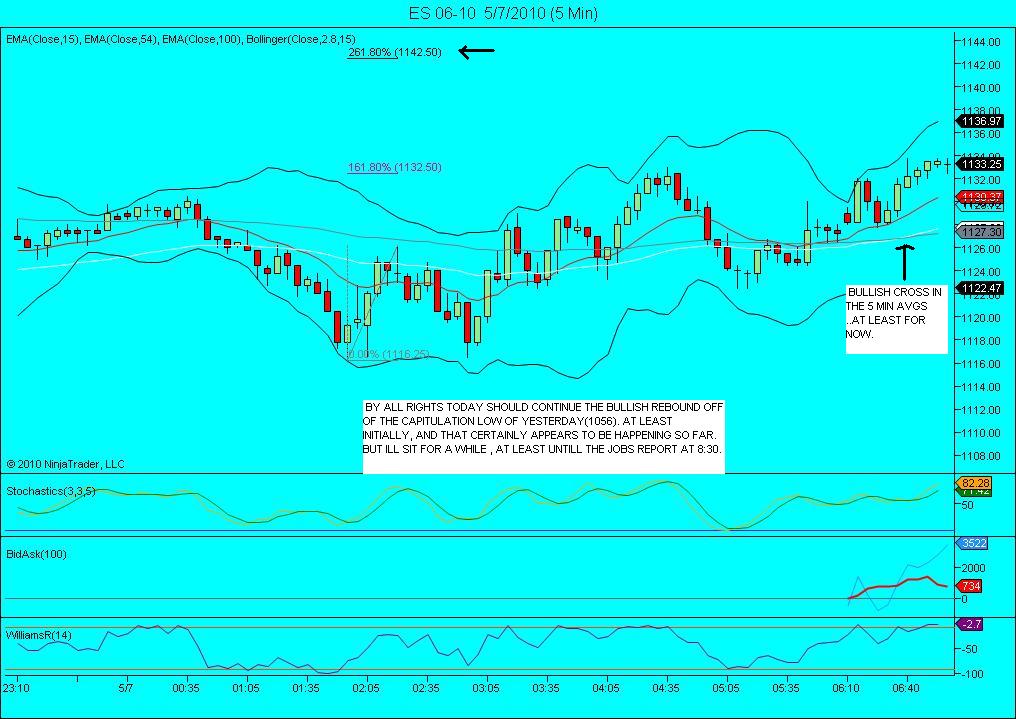
Numbers to watch on the upside include 1133.75,1136.75 and 1141 - 1142.50 and where the whole mess started, i think it was around 1146-8? Ill cover lower numbers when they are projected.
Click image for original size
Key numbers for me
1113
1125
38 - 40
50 - 51***
59
In current O/N we have the 30 and 33.50 building volume,,,and 26.50 is sloppy meaning they should try to fill that in...
1113
1125
38 - 40
50 - 51***
59
In current O/N we have the 30 and 33.50 building volume,,,and 26.50 is sloppy meaning they should try to fill that in...
Bruce,
trips at 1124.75, is that your 1125 number?
FWIW, gapguy filtered for days following 2.5% or larger close to close loss, 85% of them close opening gap by end of day. Yest close was 1122.75.
also, Najarian on cnbc explained that since the Nasdaq busted so many trades, net effect is some people short: bought at ridiculously Low prices, later sold to book long sided profits, but had initial purchase wiped out, so net short, have to cover.
I can't give a definitive rule associated with the following observation, but belive me, there is a pattern I have seen repeatedly in my ongoing and never ending study of the overnight (AH, after hours),
3 pushes. 3 pushes show up regularly (I am looking at 30min bars to identify 3 pushes in the AH. JUST AH.
3 pushes. 3 pushes show up regularly (I am looking at 30min bars to identify 3 pushes in the AH. JUST AH.
Click image for original size
To me the high at 1135 looks a good target as it is the range high (8:30-9:90 est) AND OH. Also the pivot is a good target. So I am going to place a sell at RH and a buy at PP. The present direction is south but we are opening on Previous day range so an upward push at open is anticipated. Also I am going to wait for the tick at open to go red and sell.
Bingo got it
thanks for the chart..have a great weekend
Emini Day Trading /
Daily Notes /
Forecast /
Economic Events /
Search /
Terms and Conditions /
Disclaimer /
Books /
Online Books /
Site Map /
Contact /
Privacy Policy /
Links /
About /
Day Trading Forum /
Investment Calculators /
Pivot Point Calculator /
Market Profile Generator /
Fibonacci Calculator /
Mailing List /
Advertise Here /
Articles /
Financial Terms /
Brokers /
Software /
Holidays /
Stock Split Calendar /
Mortgage Calculator /
Donate
Copyright © 2004-2023, MyPivots. All rights reserved.
Copyright © 2004-2023, MyPivots. All rights reserved.