ES short term trading weekend preview 5-08-10
To say last week was interesting severely understates the facts, doesn't it? The profits for the whole year wiped out in about 30 min. A roughly 30 handle stretch at the lows where there were virually no bids in the pits! The usual fantasy stories (fat finger theory!)about the events and a vix at 40! Normally , a reading over 32-35 seems to mark intermediate type bottoms. new highs 52, new lows 216! Payment for all the index rise thru ugly fundementals? Or just an aftershock from last years devestating bear earthquake? And now , what could be , just as interesting of a week ahead. observe the calendar. Mon-tues look to be fun ,and friday too!....
Click image for original size
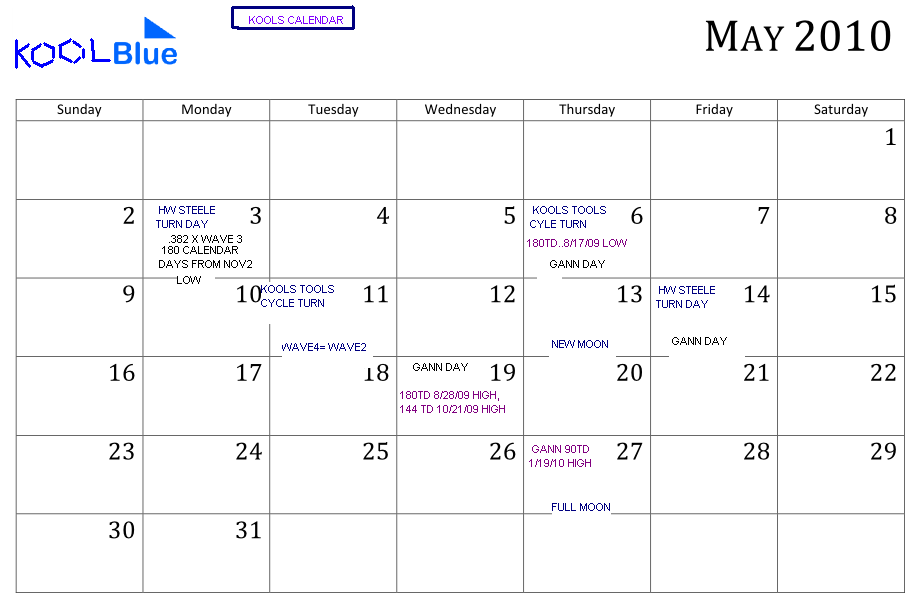
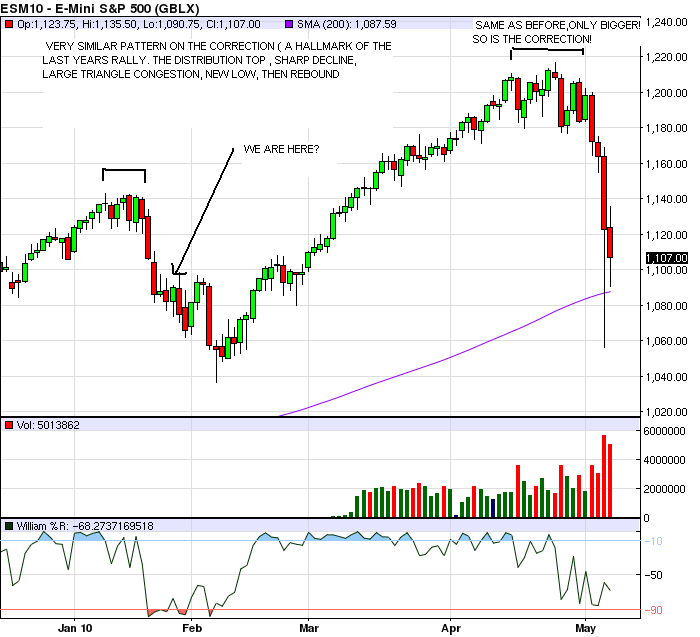
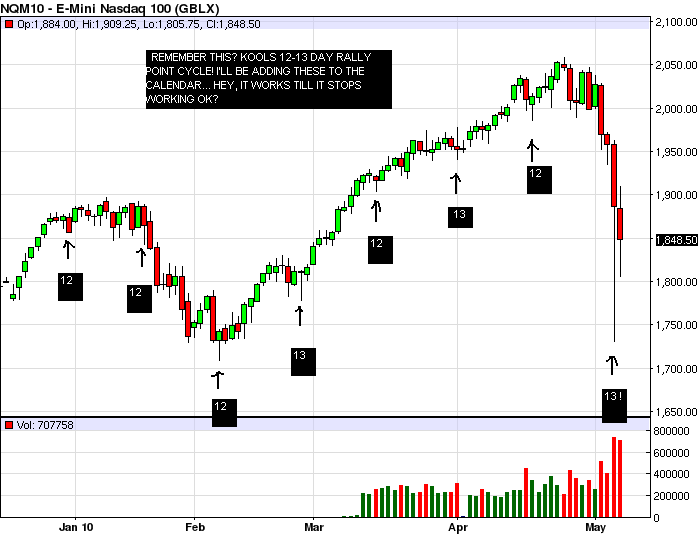
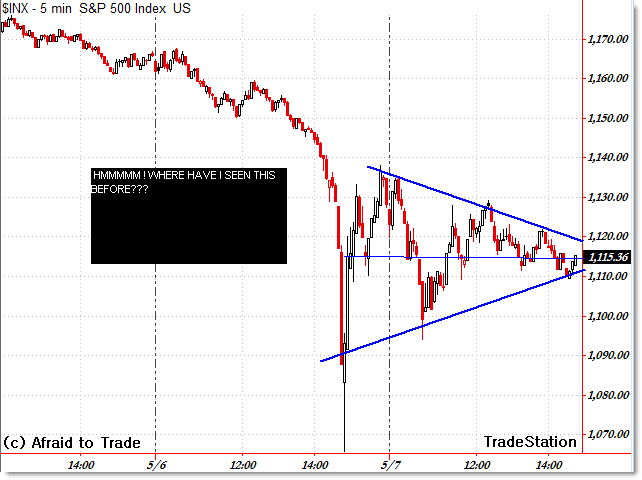
The sense from most of the web is that were in a 4th wave triangle in a 5 wave down move with one last move down to come this week.And indeed Kools tools had termination ratio numbers from the 1216 high around 1047-1052 which havent been quite achieved yet. I'll buy their theory if you throw in the possibility of a a 'truncated' 5 th wave. Ive already covered why this decline has earmarks of a 'capitulation' bottom.And ive showed in past opinions why i believe new rally highs lie ahead (into a July top?). Anyway , more to the short term setups for next week. All year the 'fractal' nature of declines has been in evidence.Tues marks the time when this decline will equal January's ...
Click image for original size
All of the criteria for a critical cycle bottom have been met. For those of you who enjoy cycles as i do , heres some interesting charts courtesy of Helge... first the longer term seasonal...
Click image for original size
As a market historian, ya gotta love the action. Remember the historic 780 point decline OCT 15 2008? Forget it. May 6th the Dow declined 600 points in less than 10 minutes! And it was already down 300 on the day!The PPT is in disarray (Treasury vs Goldman Sucks), and the Vix is soaring. But in closing, i'll just say that this is what bottoms smell like.My 401 k which i took to 50% cash bout a month ago at 1120 because of the imminent danger will likely go back to 100% long sometime in the next few days or weeks. In the meantime, we are in day traders heaven right now with all the quick intraday moves up and down. Keep smilin, we made it thru 08 and 09! And this too will end (maybe sooner than you think!)
Click image for original size
Click image for original size

..Courtesy Helge...
And a closer look....
Click image for original size
Hi Koolblue,
Great info and charts there.
Hope you don't mind if I added my $0.02 here....
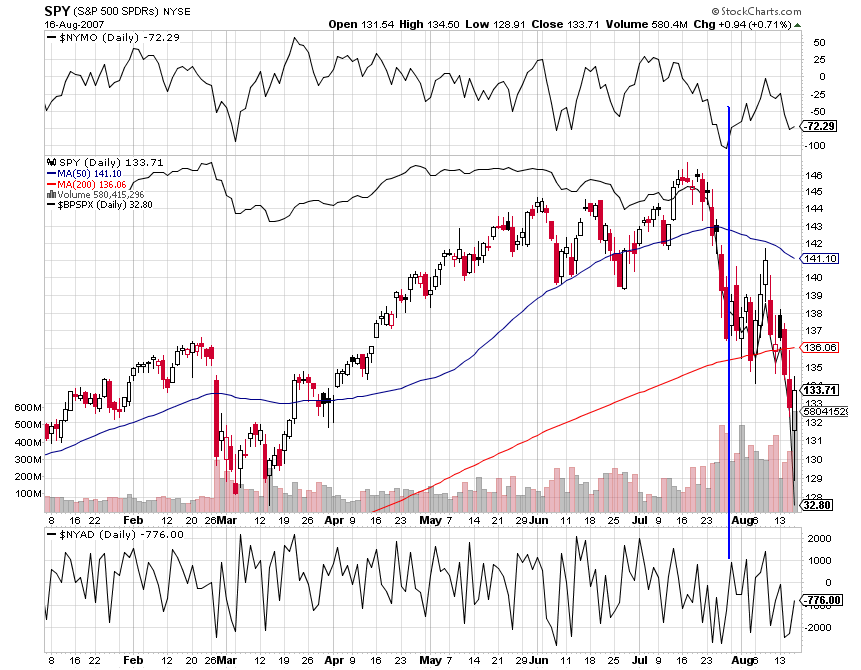
I've made reference to the 2007 charts several times in this board. Here is the reason why:
The action in 2007 is eeriely similar to what we are witnessing today:
- big 85+ pt drop
- hammer reversal
- low volatility run-up to new contract highs
- volatility expansion that leads to an even bigger drop
- 50d EMA rolling over, but 200SMA still rising.
Back in 2007, NYMO peaked first, and then put in a higher low (+ve divergence). That, along with a high volume white candlestick marked the short term bottom.
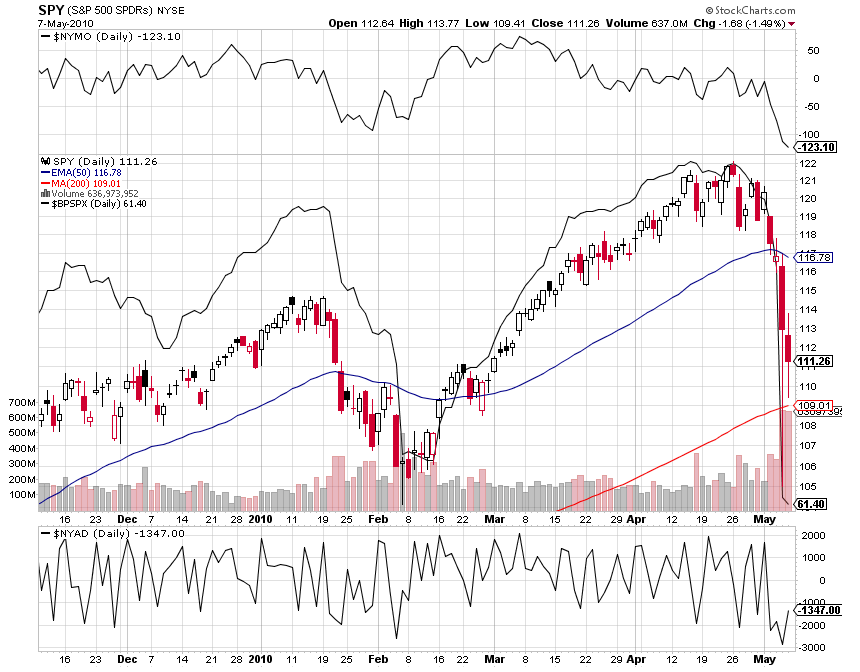
So, here's where we stand today:
- big 100pt drop
- hammer reversal
- low volatility run-up to new contract highs
- volatility expansion that leads to an even bigger drop
- 50d EMA rolling over, but 200SMA still rising.
However, NYMO has not yet put in a higher low. Also, on Friday we had a 40pt selloff, but no bullish response to it (couldn't close above 1122.75). So I don't think the short term bottom is in yet.
I would tend to agree with you KoolBlue that we could see new contract highs after this correction. My rationale is that the 200SMA is rising, and this is the very first time it has been tested.
However, my own analysis based on past corrections (Aug07, Jan10) suggest that we could see one more capitulative flush down before we march on to new highs. Certainly the current downtrend of lower highs and lower lows needs to be broken before any meaningful rally can take place.
As for Monday, well, I think we will conform yet again to Mutual Fund Monday. But I think it will be a dead cat bounce that does not affect current market structure.
Great info and charts there.
Hope you don't mind if I added my $0.02 here....
I've made reference to the 2007 charts several times in this board. Here is the reason why:
Click image for original size
The action in 2007 is eeriely similar to what we are witnessing today:
- big 85+ pt drop
- hammer reversal
- low volatility run-up to new contract highs
- volatility expansion that leads to an even bigger drop
- 50d EMA rolling over, but 200SMA still rising.
Back in 2007, NYMO peaked first, and then put in a higher low (+ve divergence). That, along with a high volume white candlestick marked the short term bottom.
So, here's where we stand today:
Click image for original size
- big 100pt drop
- hammer reversal
- low volatility run-up to new contract highs
- volatility expansion that leads to an even bigger drop
- 50d EMA rolling over, but 200SMA still rising.
However, NYMO has not yet put in a higher low. Also, on Friday we had a 40pt selloff, but no bullish response to it (couldn't close above 1122.75). So I don't think the short term bottom is in yet.
I would tend to agree with you KoolBlue that we could see new contract highs after this correction. My rationale is that the 200SMA is rising, and this is the very first time it has been tested.
However, my own analysis based on past corrections (Aug07, Jan10) suggest that we could see one more capitulative flush down before we march on to new highs. Certainly the current downtrend of lower highs and lower lows needs to be broken before any meaningful rally can take place.
As for Monday, well, I think we will conform yet again to Mutual Fund Monday. But I think it will be a dead cat bounce that does not affect current market structure.
Click image for original size
Click image for original size
thanks for all the great posts and charts on this thread. nice work!!!
Emini Day Trading /
Daily Notes /
Forecast /
Economic Events /
Search /
Terms and Conditions /
Disclaimer /
Books /
Online Books /
Site Map /
Contact /
Privacy Policy /
Links /
About /
Day Trading Forum /
Investment Calculators /
Pivot Point Calculator /
Market Profile Generator /
Fibonacci Calculator /
Mailing List /
Advertise Here /
Articles /
Financial Terms /
Brokers /
Software /
Holidays /
Stock Split Calendar /
Mortgage Calculator /
Donate
Copyright © 2004-2023, MyPivots. All rights reserved.
Copyright © 2004-2023, MyPivots. All rights reserved.