I just need help, charts are included
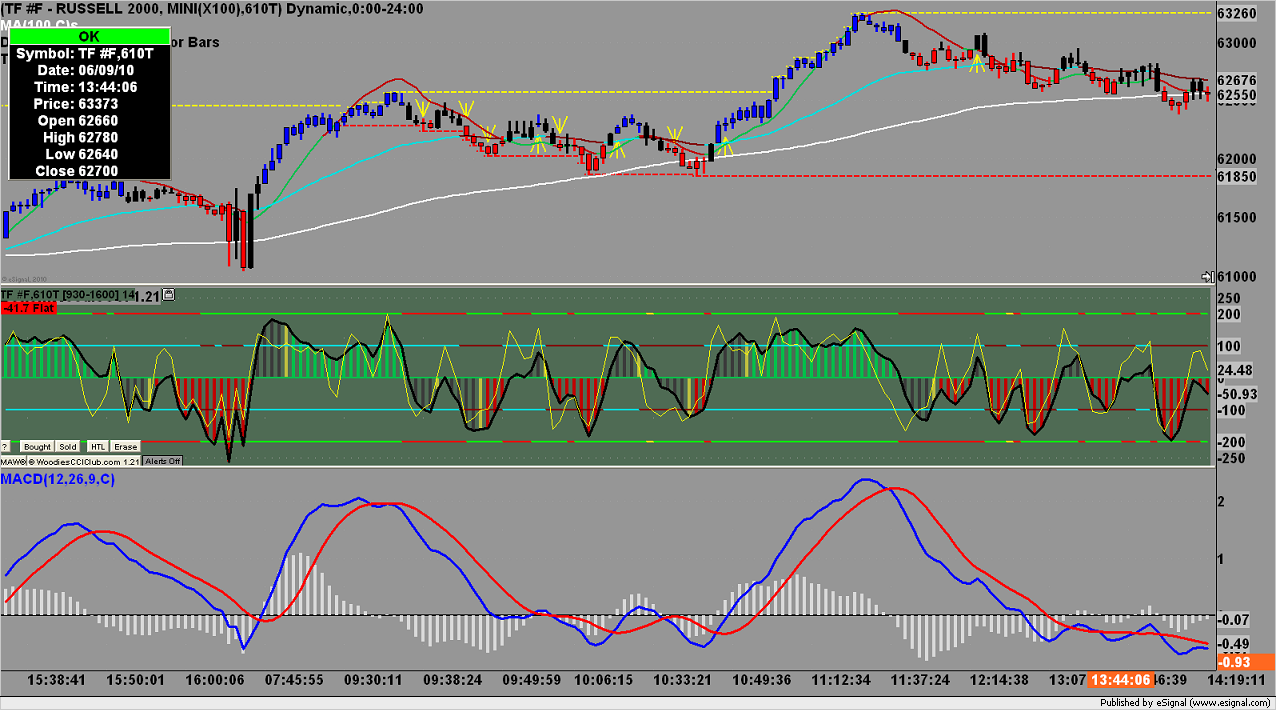
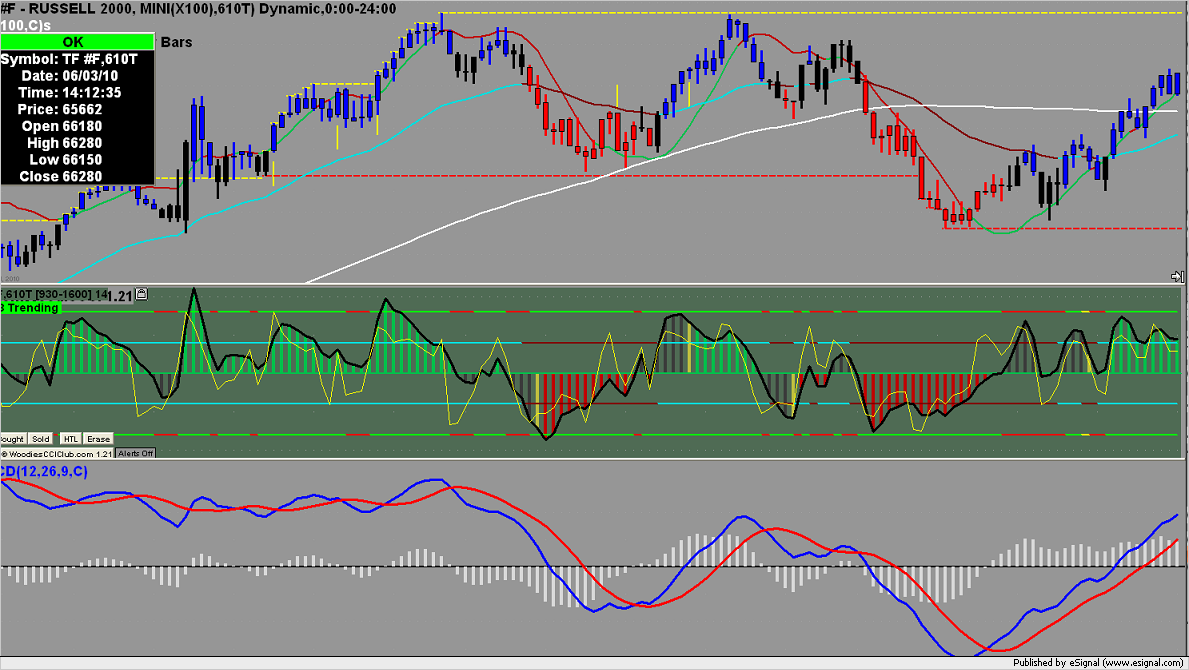
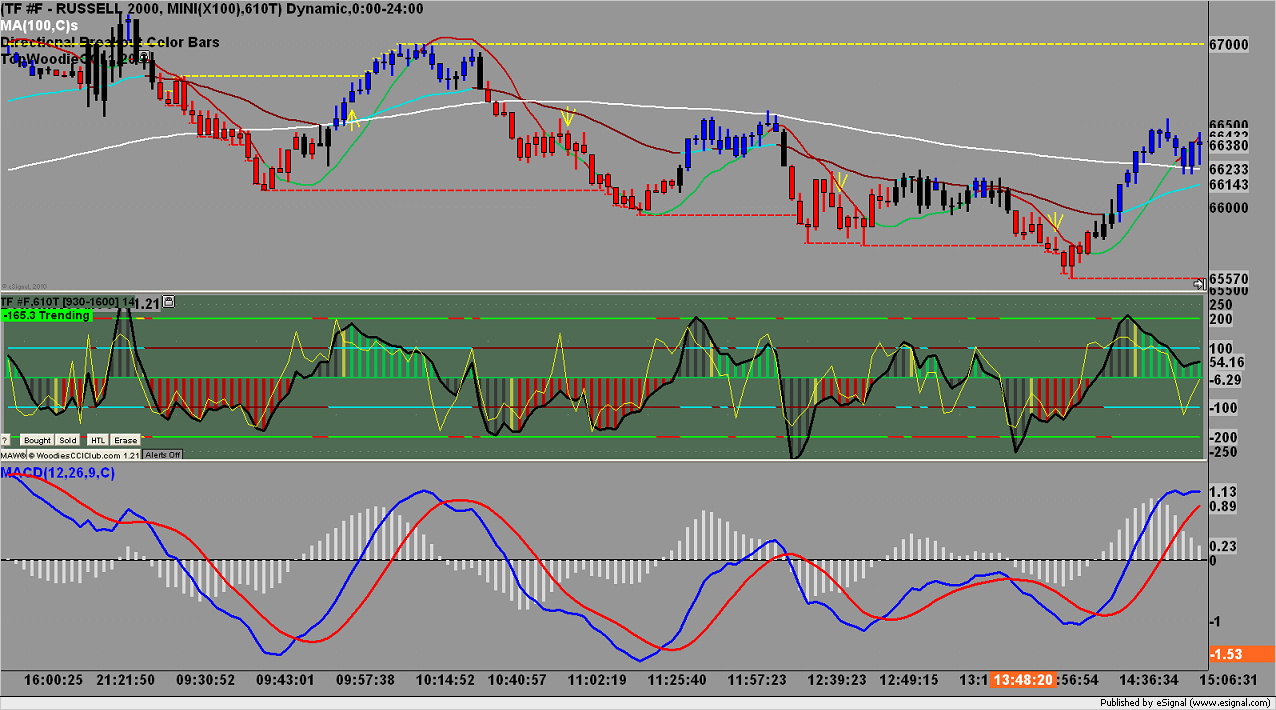
I've been trying to trade the Russell 2000 for six years now. I have had no sucess. The longest I went without losing for the day, was six days. I'm placing some pictures of my trades from today June 9, 2010.
I can not figure out how to get a good entry, that does no constantly go against me atleast 25 ticks. If I set a stop of 15 ticks, it might get hit, most of the time it will. Then again sometimes it will go against me 25 ticks and then turn around and go my way.
Yes I use a MACD, mainly because I can't figure out how to get away from it. I use woodies CCI, and one of my trades is triggered when the 6 period cci ( the yellow line ) closes above or below the zero line. I use a program called " directional breakout " that I downloaded from esignal.
I'm going to upload the past five days charts.
Click image for original size
Click image for original size
Click image for original size

Click image for original size

Click image for original size
Originally posted by ak1
Well here is your first lesson. Using a 30 min candle stick chart note the 10:00 est close and use it to enter a trade using a 5 min FEB method.
Hi ak1, What is the 5 min FEB method? Can you please link me up if it is already described elsewhere on this forum?
Ok thank you I'll start looking into what you are talking about. As well as the other markets. Thank you
Emini Day Trading /
Daily Notes /
Forecast /
Economic Events /
Search /
Terms and Conditions /
Disclaimer /
Books /
Online Books /
Site Map /
Contact /
Privacy Policy /
Links /
About /
Day Trading Forum /
Investment Calculators /
Pivot Point Calculator /
Market Profile Generator /
Fibonacci Calculator /
Mailing List /
Advertise Here /
Articles /
Financial Terms /
Brokers /
Software /
Holidays /
Stock Split Calendar /
Mortgage Calculator /
Donate
Copyright © 2004-2023, MyPivots. All rights reserved.
Copyright © 2004-2023, MyPivots. All rights reserved.