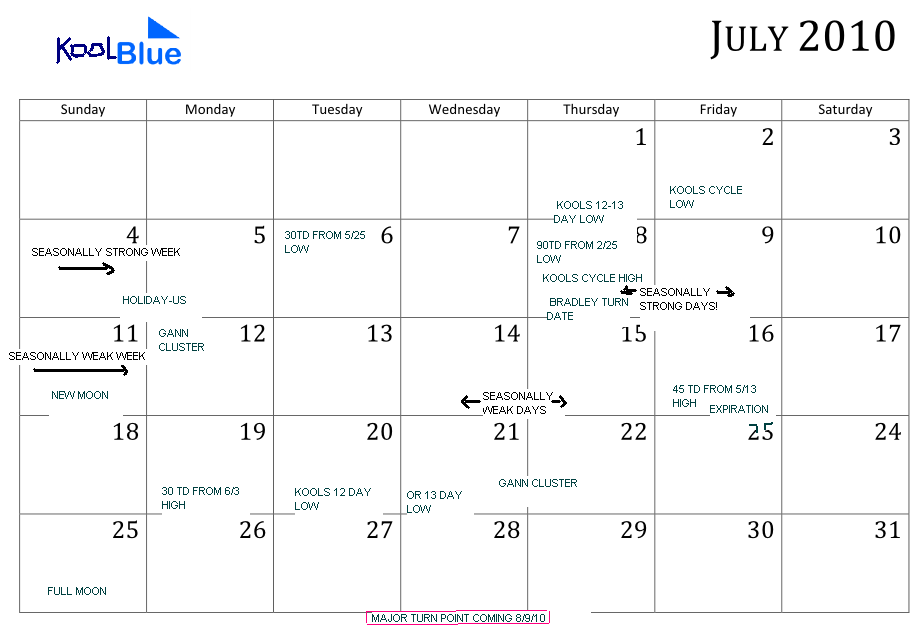
July preview es short term trading
Hey, im trading the mud ,but i havent forgotten my es pals!...
Click image for original size
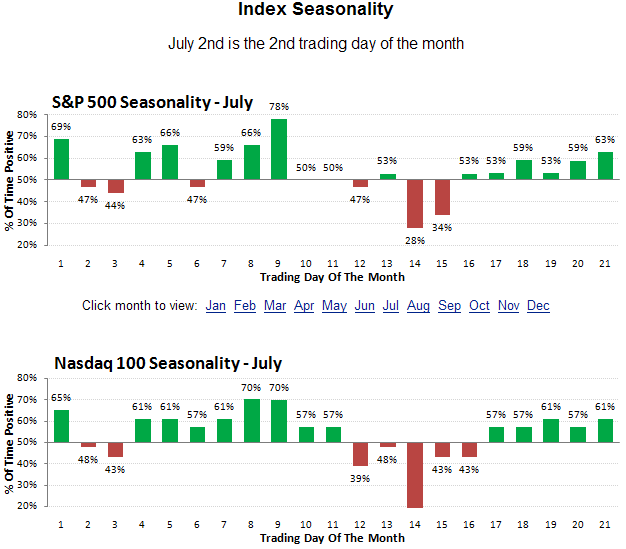
courtesy sentimenttrader...
Click image for original size
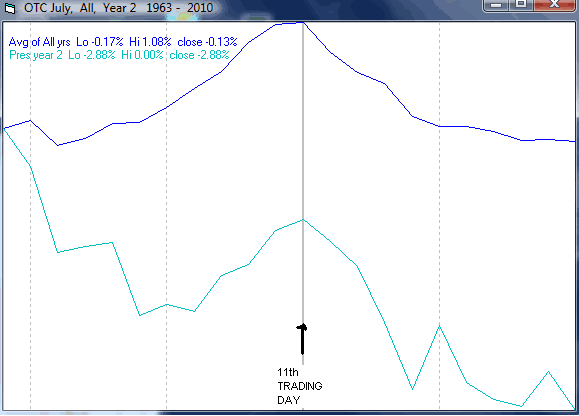
and another take,courtesy Mike Burk..(I lend more weight to sentiment traders stats)...kool
Click image for original size
Thanks Kool I'm going to print these out and use them as references this month.
Originally posted by koolblue
courtesy sentimenttrader...
Click image for original size
Great posts as usual, KoolBlue.
Here's the seasonality map from the marketSci blog (which takes into account holiday effects, OpEx, and general monthly tendencies):
Click image for original size

Where this seasonality map agrees with yours, I am interested. In particular:
- both are in agreement with the first session after Independence day being weak and closing down.
- both are in agreement with the week after OpEx (Jul.19) as being a weak week.
- both are in agreement with the last week of July as being seasonally strong.
Click image for original size
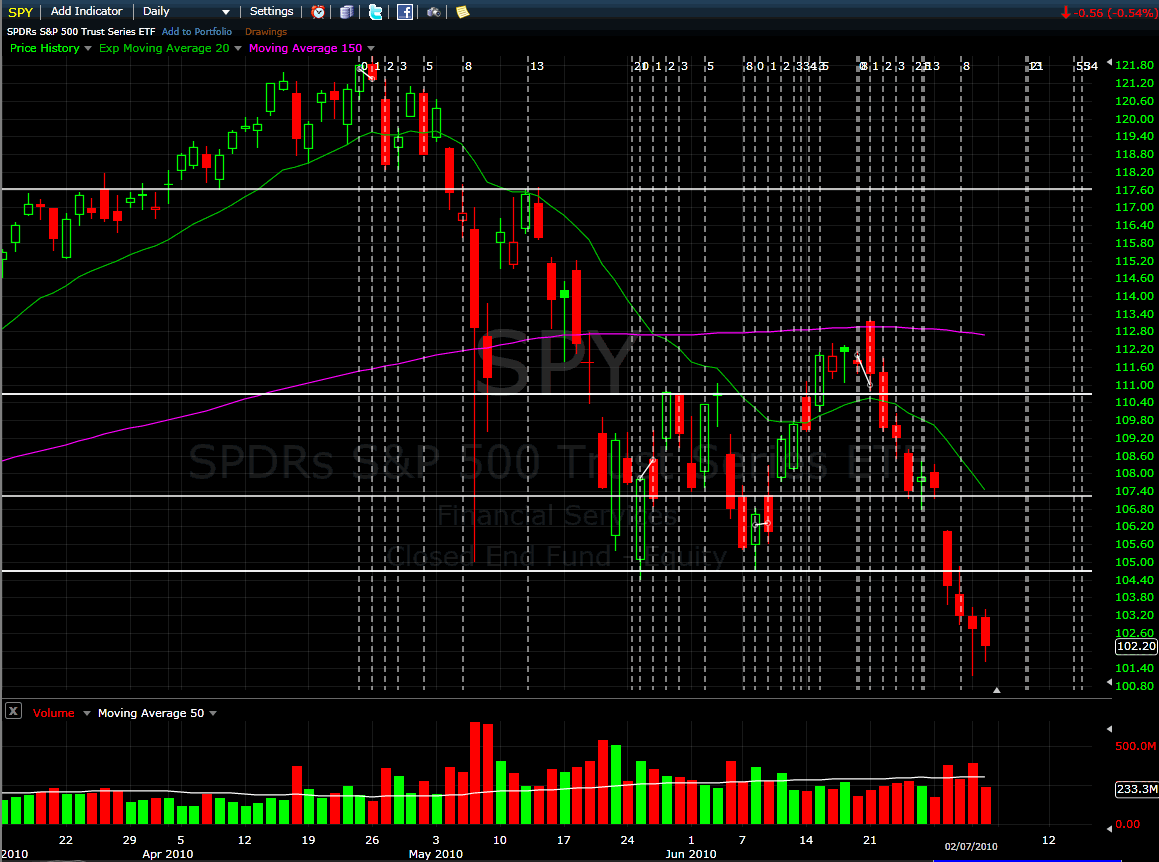
I also played around with some Fib Time Projections. Using Apr 23 hi, May 25 lo, and Jun 8 double bottom as anchor points, the Fib Time Projections indicate the earliest that this selloff could end would be Thurs. Jul 8. Coincidentally, this lines up with your Bradley Turn Date.
At the beginning of June, you projected 1008, and here we are, imagine that!
http://www.mypivots.com/board/topic/5784/1/es-short-term-trading-weekend-preview
Also, on Jun 30, you projected 950-960 target:
http://www.mypivots.com/board/topic/5890/1/es-short-term-trading-6-30-10
I think that if we see 960 by wednesday, then I would be much more confident in Thurs. Jul 8 being the cycle turn.
Try as I might, I can't find any evidence or even a rational argument for this past Thur's. 1007 Lo as being the bottom. Currently, the market closed down in 10/11 sessions. The last time something comparable to this sustained downard momentum occurred was:
Nov.2008: 9/12 closed down, and
Mar.2009: 13/16 closed down.
In both cases, what terminated the downtrend was:
2 days where close > open
2nd day gaps up and closed above the hi of 2-3 days prior
So because of the way the session closed on Friday, there is just no indication that the selling is over, and therefore, I would be surprised if 1007 was the bottom. In my opinion, I think we will take out the 1007 low, and possibly drop to 980 before a bounce materializes.
That said however, if Thurs. was the low, then my trigger for a relief rally would be :
- gap up, initiative rally above 1032, and close near the highs of the day.
Cant believe everyone was trying to sell today!..look at the calendar i posted and the seasonality!...sigh!... Tomorrow (July 8 is a different story however!. Could be a short term top right around current levels(1060.50) ...time will tell...Kool
c'mon Kool..that's not like u to poke fun at us sellers...always easy to see it after it ends.....losing day for me today...thank you very much!!!
Originally posted by koolblue
Cant believe everyone was trying to sell today!..look at the calendar i posted and the seasonality!...sigh!... Tomorrow (July 8 is a different story however!. Could be a short term top right around current levels(1060.50) ...time will tell...Kool
In the chat room you said today was the 11th trading day of the month...I have it as the 9th trading day and the day that we were suppose to be so bullish...am I reading the chart wrong?
Please confirm ...
Please confirm ...
No, Bruce, you are correct... i forgot about the holiday!!! lol.. sorry about the miss post!
Interesting how yesterday actually played out. A tug between bulls/bears rather then a huge bull run.
Emini Day Trading /
Daily Notes /
Forecast /
Economic Events /
Search /
Terms and Conditions /
Disclaimer /
Books /
Online Books /
Site Map /
Contact /
Privacy Policy /
Links /
About /
Day Trading Forum /
Investment Calculators /
Pivot Point Calculator /
Market Profile Generator /
Fibonacci Calculator /
Mailing List /
Advertise Here /
Articles /
Financial Terms /
Brokers /
Software /
Holidays /
Stock Split Calendar /
Mortgage Calculator /
Donate
Copyright © 2004-2023, MyPivots. All rights reserved.
Copyright © 2004-2023, MyPivots. All rights reserved.