ES short term trading 6-30-10
In my opinion the market tipped its hand yesterday signalling lower ,possibly much lower, prices coming in the next few weeks/months.Try as i might i cant find any longer term projection, or for that matter, fib relationship of any kind that says 1030 could be the bottom of the decline which started in April!. Therefore, from a kools tools perpective, There are lower prices coming soon! so like everyone else, i expect an oversold market to muster a dead cat bounce of some sort ,but likely from slightly lower prices first. The closest numbers i can find are the original high of 1129.50 to its initial move low was 1103.25. this has a 4.236 termination ratio of around 1018.50 and if A was from 1211.25 to 1032.75 ans B was complete at 1129.50 then C=.618A AT 1019.25. Look folks, i know im really reaching here but,1030 is NOT 'THE BOTTOM'And i dont think 1018-19 is either (we'll see the 900 's at some point.) but this zone might be good for a dead cat bounce. right now i have short term projections around 1023.50-1024.75 which could do the same. Its also possible of course that the bounce has already started , we'll just have to see what develops today . Anything is possible today, but by all rights seasonally thurs and friday should have some upside pressure. The main point of this discourse is that much lower prices are ahead in the next month or so (950-960?) in my opinion. As always time will tell!... good luck gang!
Food for thought!...
Click image for original size

Click image for original size

Click image for original size
I totally agree with you on the inevitability of lower prices in the near future.
As for the dead cat bounce, I don't know if it has started, but I think we will see a bounce of some sort tomorrow for the following reasons:
1) RSI(3) is at 5.95, an area where previous bounces have occurred this year.
2) NYAD is below -2500, also an area where previous bounces have occurred.
3) We've had unabated selling in 6 of the past 7 sessions. The last time this occurred was mid-May, and that ended with a bounce on the 7th session.
Where we open tomorrow will be important, as I will be looking for reasons to go long targetting the opening price if it is not another monster gap size like the -16pts we saw today.
Looks like we have a head & shoulders pattern on the daily with a breach of the neckline forming on the right shoulder. Also, the 50/200MA is about to cross over.
Some numbers i'll be keeping an eye on today...
Click image for original size

Im often irritated by the number of people who pay large sums of money for trading strategies, rooms etc! The whole reason i developed my Kools Tools was because of my belief that each one of us can be our own 'guru'... and do an equal (or usually better job) than the high priced scam artists. Heres a few simple tricks to keep in mind and practice:.. First, charting 101, on any time frame, EARLY STRENGTH,FOLLOWED BY LATE WEAKNESS IS BEARISH. Likewise, EARLY WEAKNESS, FOLLOWED BY LATE STRENGTH IS BULLISH..for instance,2 days ago (Friday, the high of the rth was hit early (i think by around 10:30am, while the low for the session was much later,around 3:30or so before a little pop up into the close. This was a typically bearish pattern for the next session (yesterday) and proved to be the case! This kind of pattern, holds true for all time frames, but especially daily and weekly ones! Again a week ago, the bearish pattern of an early high (Monday we hit that 1131 i think) was followed by late weakness (the weekly low was Friday). This is bearish and portended lower prices this week, at least initially. So always be aware of the general price action in regards to the high and low ...and when they occur! Its easy, its simple, and is another tool for your trading arsenal!... Now regarding trading ranges: I use trading ranges like other people use volume.Just like the whole premise that gave birth to Kools Tools( the initial move off a price gives a clue as to much gas is in the tank before the ineviatable stop and turn),i think expansion,or contraction, of a daily (or weekly for that matter) range give a clue to the power of the resulting move! For example, last week the daily range, as noted in Daytraders daily notes page here at mypivots was around 19.80 handles (on the 5 and 10 day basis). After a day or 2 around those ranges , suddenly last Thursday we had an expansion of range on a down day! This is bearish.(again substitute vol. if you prefer, it was a down day on greater vol than the day before). Then Friday was an up day but with a contraction in range(and yes vol) which was bearish! Then Monday was a down day on less vol. which could be construed as positive, but it also registered a higher high than the day before on less vol which ,strictly using vol could pass as negative. Lets just call it what is was, a wash! However the daily range once again contracted even more! To around 13 handles i think, leading to me commenting to Bruce that night that i sensed an explosive range expansion coming soon. And he was pondering the same thing! Of course, the rest history. Try watching the price action for a while and you too, will get a 'feel' for whether were in a bearish, or bullish mode! A nd you'll save a whole lot of money! lol
Whew back to the market just in time! Tho we might be starting a down trend for a while,after up most of the night session( i dont know,) im trying to scalp a small long here! high 1044.50 to initial low later of 1041.25 is 3.25 handles and the 2.618 comes in at 1036.00 which is where i went long...ugh... 3 point stop ,so 1033 gets me but at least its one es only...
well my gut tells me i should have exited at the 1.618 of 1037.50, butits too late now ,so im going to have to try for the 2.618 at 1039 and change.
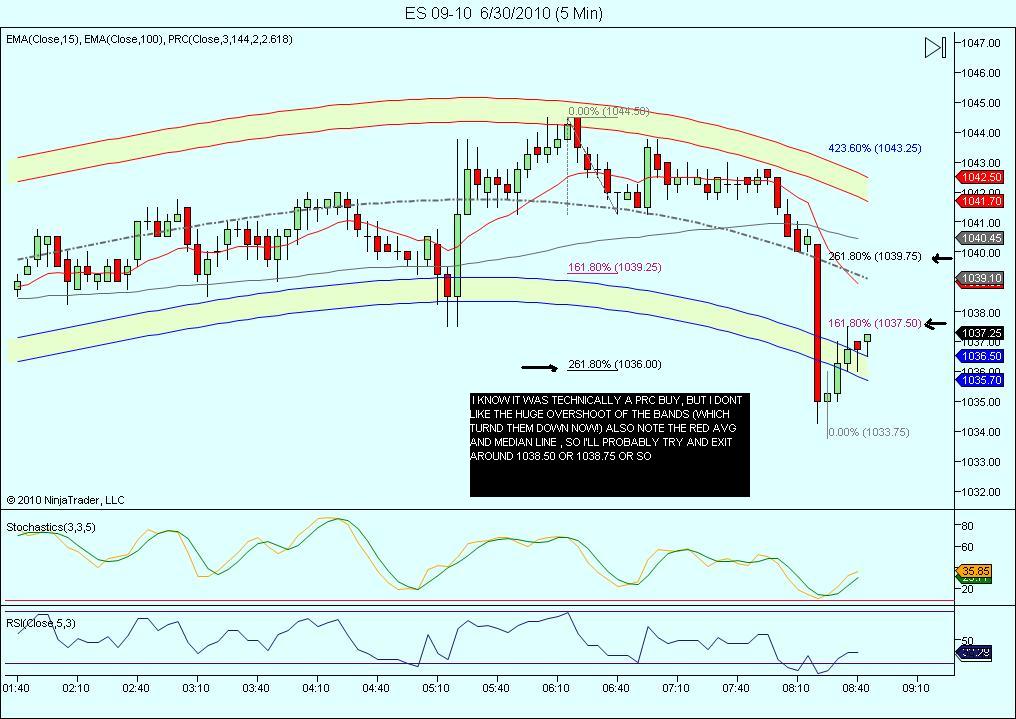
stopped at breakeven...1036.00 no harm no foul.... watching im actually hoping the downside is not quite done yet... Once we open the rth, im hoping for early weakness ,followed by late strength, which set up bullishness for thurs and friday!...we'll see
"went short at 38 even. I had a bearish bias this afternoon and after the fake breakout to the upside it confimed me going short"
Emini Day Trading /
Daily Notes /
Forecast /
Economic Events /
Search /
Terms and Conditions /
Disclaimer /
Books /
Online Books /
Site Map /
Contact /
Privacy Policy /
Links /
About /
Day Trading Forum /
Investment Calculators /
Pivot Point Calculator /
Market Profile Generator /
Fibonacci Calculator /
Mailing List /
Advertise Here /
Articles /
Financial Terms /
Brokers /
Software /
Holidays /
Stock Split Calendar /
Mortgage Calculator /
Donate
Copyright © 2004-2023, MyPivots. All rights reserved.
Copyright © 2004-2023, MyPivots. All rights reserved.