ES Short Term Trading 8-23-2010
Kool's 12-13 Day Low is Monday - Tuesday.
I'm using 1076.75 for the weekly pivot. Also, 1077.75 is the weekly volume POC.
I have 74.25 for weekly POC but I'm not including O/N session...we are up here now so we may find out
I'm more interested in how they handle 80 - 83 this week or ASAP///
Looking at my number again and I'm showing 1077.25 not 1077.75 as volume POC. Just to be clear I'm not talking about the TPO POC but the POC based on volume. Is that what you are referring to?
And I'm not including O/N in my profile either.
And I'm not including O/N in my profile either.
Originally posted by BruceM
I have 74.25 for weekly POC but I'm not including O/N session...we are up here now so we may find out
mine is based on Volume too....sometimes scaling can be an issue but perhaps mine is off due to IB's dealing with volume...anyway make sure you have it in .25 increments..sometimes to fit on a screen I scale it too .50 and it messes up my readings....not sure which one is right....perhaps someone else still reads these and can help out
Very week volume here in the O/N.
Maybe everyone is taking a long weekend before back to school.
Volume building between 1074-1073.50 and VWAP is supportive at the moment. RTH could quickly change things but its useful to see how O/N is behaving.
Maybe everyone is taking a long weekend before back to school.
Volume building between 1074-1073.50 and VWAP is supportive at the moment. RTH could quickly change things but its useful to see how O/N is behaving.
Click image for original size

we are at key support of 67 - 69 from friday...singles above!!
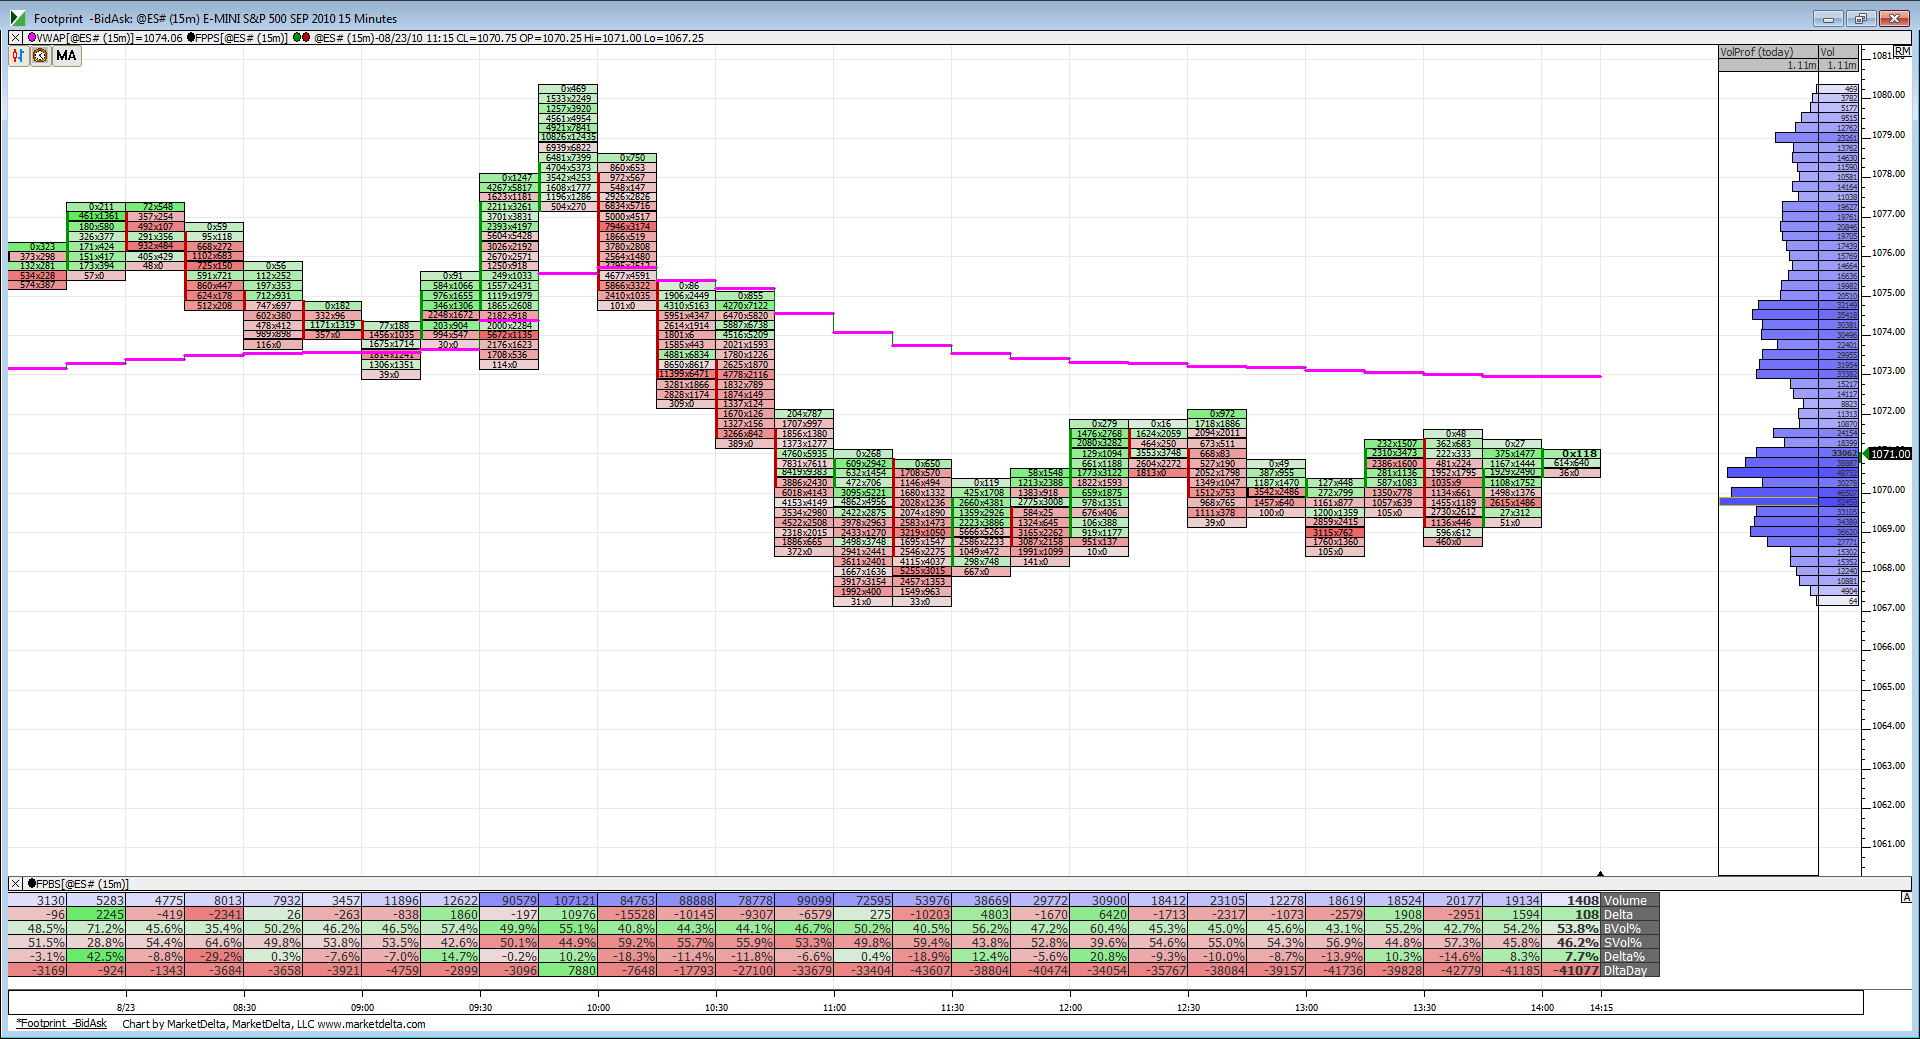
Volume building in this 1069-1071 range. Notice the deltaday at the bottom of the chart. Its quite negative, meaning more volume has transacted at the bid then ask today. If prices break lower from this range and delta keeps building negative it would indicate real selling. On the flip side, if prices break higher we could have a bit of short-covering to drive prices higher.
Click image for original size
Someday I'll get to typing up some more on this but for now this will do and those that get inspired will find their own method....here is how my______ chart ended last week. we've had two key zones that came into play so far today...
DELETED due to fragile ego ....LOL
DELETED due to fragile ego ....LOL
Originally posted by BruceM
It's sad to think that out of the 300 or 400 views this thread has had that NOBODY could of helped us out with Their POC as per volume from last week...?I'm deleteing my last two posts...as it can't all be so one - sided on these boards...we need more giving and less taking....so I can't continue to share things I'm working hard at...I'll stick to posting the ideas that still work but keep the newer ones to myself and emails...Originally posted by BruceM
mine is based on Volume too....sometimes scaling can be an issue but perhaps mine is off due to IB's dealing with volume...anyway make sure you have it in .25 increments..sometimes to fit on a screen I scale it too .50 and it messes up my readings....not sure which one is right....perhaps someone else still reads these and can help out
I enjoy all the posts Bruce! I am learning new tricks, but I am not able to assimilate all the info you are keeping in the air in a manner to benefit my trading.
I need to trade with my eyes. Support/Resistance, breakouts and pullbacks. That's enough for me to handle. LOL!. I would love to be able to process the data as well as you and others do, maybe someday.
Good trading to all.
FWIW, my eyes see a lot of support at 1061-1063 area based on closes in mid July. First retest of those areas.
Emini Day Trading /
Daily Notes /
Forecast /
Economic Events /
Search /
Terms and Conditions /
Disclaimer /
Books /
Online Books /
Site Map /
Contact /
Privacy Policy /
Links /
About /
Day Trading Forum /
Investment Calculators /
Pivot Point Calculator /
Market Profile Generator /
Fibonacci Calculator /
Mailing List /
Advertise Here /
Articles /
Financial Terms /
Brokers /
Software /
Holidays /
Stock Split Calendar /
Mortgage Calculator /
Donate
Copyright © 2004-2023, MyPivots. All rights reserved.
Copyright © 2004-2023, MyPivots. All rights reserved.