ES Short Term Trading 9-1-10
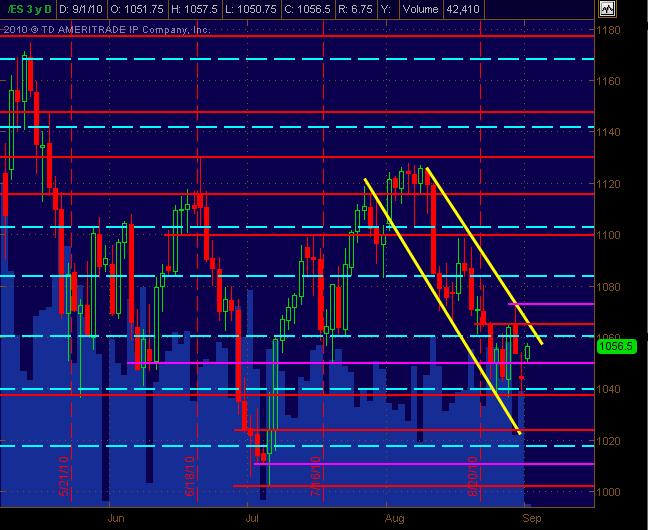
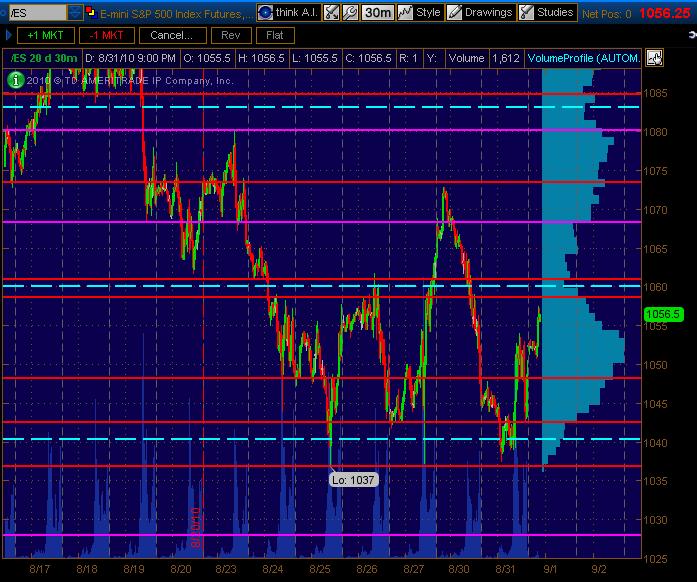
Have a daily and 30min chart with price action S/R levels on both ... Red = potentially significant ... Magenta = potentially semi-significant. The Cyan dashed lines are Wkly Pvt Levels. This is just a map.
Hope this is helpful ... am not liking TOS after a few months of digging around in it ... but this is where the charts are pulled from for now.
The Intermittent Funky Monkey
Click image for original size
Click image for original size
Hope this is helpful ... am not liking TOS after a few months of digging around in it ... but this is where the charts are pulled from for now.
The Intermittent Funky Monkey
I'm using 43.50 - 45.75 as key support...upside I have 59 -60.25 and then another line at 66.50 - 69 as a possible hurdle ..lets see what the O/N can do
they are watching that 60.25 which was a high volume node from the other day ...volume building there
gap now at 60.25....trading for it's fill!!
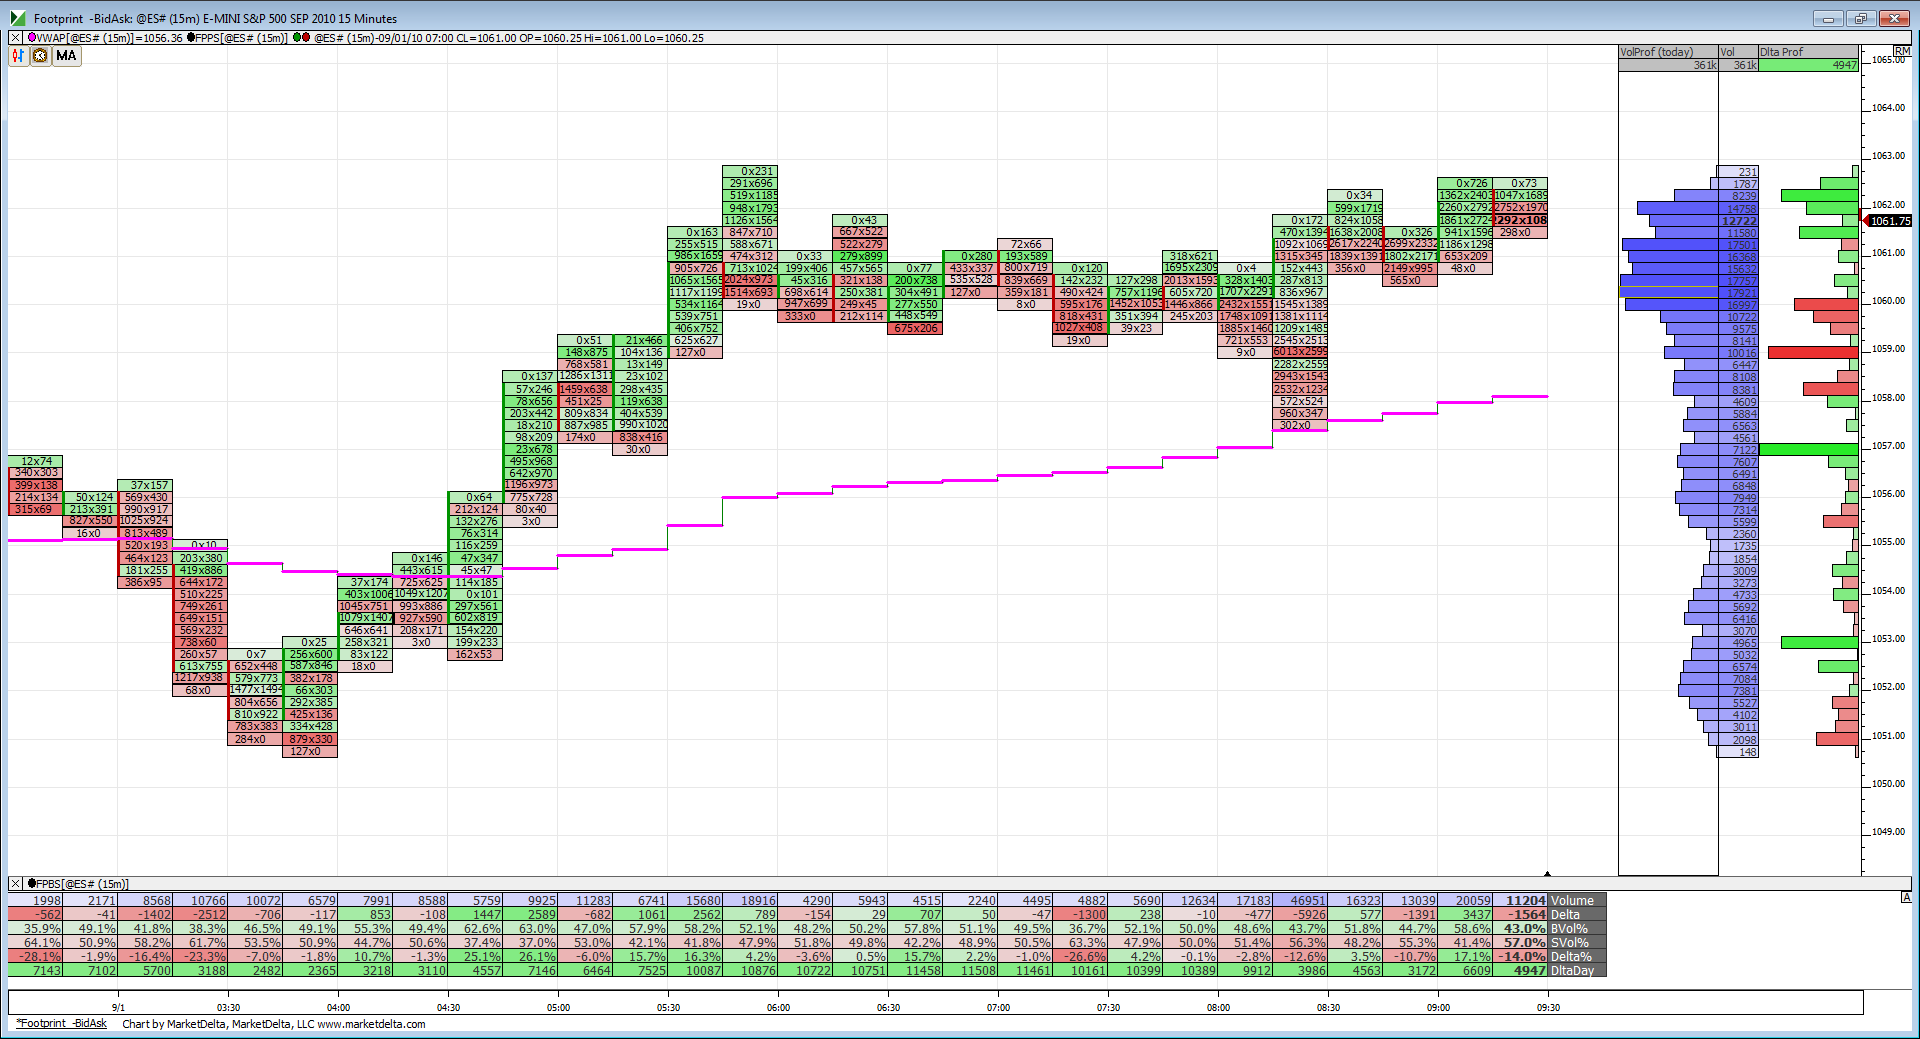
Here is a look at footprint coming into the open. Trading above VWAP for now. Can see the volume build between 1062-1060.
Click image for original size
that 51.25-.50 area is the 50% of the week, it should act like support if tested, and if not uh-oh.
also, gapguy mentioned many moons ago (I haven't gotten to his comment for today yet), that a gap up that crosses the 600 exponential moving average of RTH only has very slim odds of filling gap. Often a gap and go with only a minor retracement that is viewed as a buy.
600 exponntial moving average of the rth is 1057.91, so an open above that level would tilt odds to favor no gap fill today.
yesterday's close was 52.50.
Just a reminder-1066 is the 50% retrace 1129-1003 nonclosing basis.
peak volume is atthe highs per one minute...someone front ran my 66.50 number...should be good for us faders up here......69 - 70 is what everyone wants that is long!!
reports over..starting fades at 73.75...71.25 is first target
Back to our old friend 1075.00 What are prices going to do here?
Click image for original size

rburns:
The following is my interpretation of Paul9's findings...
On 30-Aug-2010 (Monday):
Hi = 1063.50
Lo = 1044.50
So, range = 1063.50 - 1044.50 = 19.00
So, 0.618 extension from Monday's Hi = 0.618*19.00 + 1063.50 = 1075.00 (rounded down from 1075.242)
Paul9 says that if price hits 1075.00 (as it happened today, i.e., 01-Sep-2010), then there is a high probability that the price will hit 1.000*19.00 + 1063.50 = 1082.50. Today, it did hit 1082.50.
Hope this helps.
Originally posted by rburns
Am I understanding this correctly? Take Mon H and L. Any .61 move off the bottom or top of the days range will produce a 1.61 move either higher or lower than the days range.
Emini Day Trading /
Daily Notes /
Forecast /
Economic Events /
Search /
Terms and Conditions /
Disclaimer /
Books /
Online Books /
Site Map /
Contact /
Privacy Policy /
Links /
About /
Day Trading Forum /
Investment Calculators /
Pivot Point Calculator /
Market Profile Generator /
Fibonacci Calculator /
Mailing List /
Advertise Here /
Articles /
Financial Terms /
Brokers /
Software /
Holidays /
Stock Split Calendar /
Mortgage Calculator /
Donate
Copyright © 2004-2023, MyPivots. All rights reserved.
Copyright © 2004-2023, MyPivots. All rights reserved.