Chart of the day 6108
I thought there was a thread like this but can't find it. We'll have DT move this stuff if somebody finds that thread.
Ok, Here is a pattern I've mentined a few times that happened today. It capitalizes on the first 90 minutes when we consolidate. We are basically looking to trade the 4th leg of a "M" or "w" pattern. This was taught to me by the same guy who explained the pitbull plus and minus 4 numbers etc.
Today we opend at 1133.75 in the ES and that was inside the previous days range. So we are thinking the range may be limted due to where we opened. read MOM for details.
Now the specific trade is this on the 5 minute chart ( what I was taught from):
1) You see the market Rally - Leg 1
2) You see the market Decline - Leg 2
3) You see the market rally - leg 3
4) YOU are now hunting for shorts to complete the final leg and creat the 'M' pattern.
The reverse of this pattern is that you would be trading the 4 th leg of the "W" pattern.
You can use the pitbull method on this or buy or sell into the plus and minus numbers. Here is a trade from today. Like anything else it helps to have some context to help "PULL" the market in the direction you want it to go.
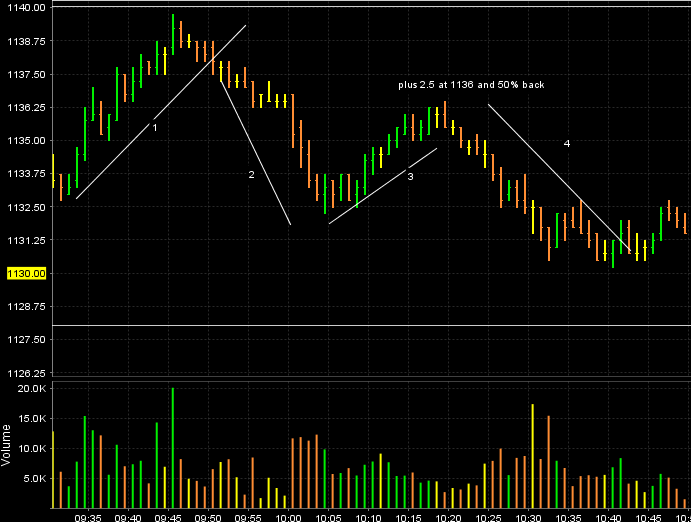
At the time this trade was taken the Overnight low or high was not taken out yet. We had the three legs of the "M" pattern and I was trying to get short as I thought they wanted the O/N low and the 27 - 28.75 area. So that was the context. The initial entry was a bit agressive and quick and personally I think it would be a safer trade to have sold the opening low ONCE you knew you were in the fourth leg of the pattern. Here is the chart for study and this is a very good example from a visual point of view. They aren't always this "pretty" and the legs aren't always this clean looking. Knowing we are consolidating helps give one confidence in the pattern
This chart shows the "legs" on a one minute time frame.
Ok, Here is a pattern I've mentined a few times that happened today. It capitalizes on the first 90 minutes when we consolidate. We are basically looking to trade the 4th leg of a "M" or "w" pattern. This was taught to me by the same guy who explained the pitbull plus and minus 4 numbers etc.
Today we opend at 1133.75 in the ES and that was inside the previous days range. So we are thinking the range may be limted due to where we opened. read MOM for details.
Now the specific trade is this on the 5 minute chart ( what I was taught from):
1) You see the market Rally - Leg 1
2) You see the market Decline - Leg 2
3) You see the market rally - leg 3
4) YOU are now hunting for shorts to complete the final leg and creat the 'M' pattern.
The reverse of this pattern is that you would be trading the 4 th leg of the "W" pattern.
You can use the pitbull method on this or buy or sell into the plus and minus numbers. Here is a trade from today. Like anything else it helps to have some context to help "PULL" the market in the direction you want it to go.
At the time this trade was taken the Overnight low or high was not taken out yet. We had the three legs of the "M" pattern and I was trying to get short as I thought they wanted the O/N low and the 27 - 28.75 area. So that was the context. The initial entry was a bit agressive and quick and personally I think it would be a safer trade to have sold the opening low ONCE you knew you were in the fourth leg of the pattern. Here is the chart for study and this is a very good example from a visual point of view. They aren't always this "pretty" and the legs aren't always this clean looking. Knowing we are consolidating helps give one confidence in the pattern
This chart shows the "legs" on a one minute time frame.
Click image for original size
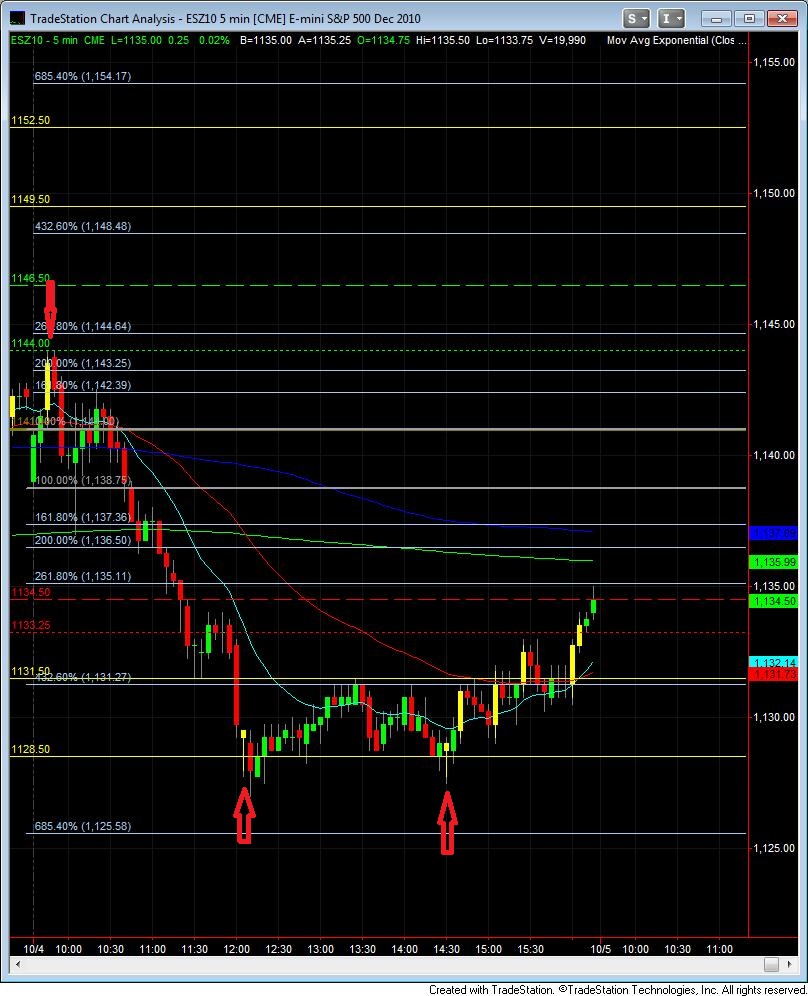
Thought it would be useful to post this chart of today's action.
I've marked the chart with red arrows showing yellow volume spike bars. The first one came right into the O/N high (green dotted line). After reversal, prices never recovered. I know this came before the 10:00am news but if one waited till after the announcement there was plenty of time to position short.
The bottoming action is highlighted by two yellow volume spike reversal bars coming off R2 of a range based support/resistance calculation. The yellow lines are a Dr. Steenbarger formula for calculating S/R using Fridays range.
Another thing to note is how prices worked through the fib matrix off the opening 5 minute bar. Just follow prices through the matrix visually and you'll see how they bounce between the proportional subdivides of the matrix....beautiful to observe!
One other thing to note. The green moving average on the chart is a 600 period moving average which behaves much like the 200 day on a daily chart. You can see how prices collapsed after the MA was broken. It had been providing support since the first test on 9/23.
Click image for original size
Emini Day Trading /
Daily Notes /
Forecast /
Economic Events /
Search /
Terms and Conditions /
Disclaimer /
Books /
Online Books /
Site Map /
Contact /
Privacy Policy /
Links /
About /
Day Trading Forum /
Investment Calculators /
Pivot Point Calculator /
Market Profile Generator /
Fibonacci Calculator /
Mailing List /
Advertise Here /
Articles /
Financial Terms /
Brokers /
Software /
Holidays /
Stock Split Calendar /
Mortgage Calculator /
Donate
Copyright © 2004-2023, MyPivots. All rights reserved.
Copyright © 2004-2023, MyPivots. All rights reserved.