ES Short Term Trading 10-8-2010
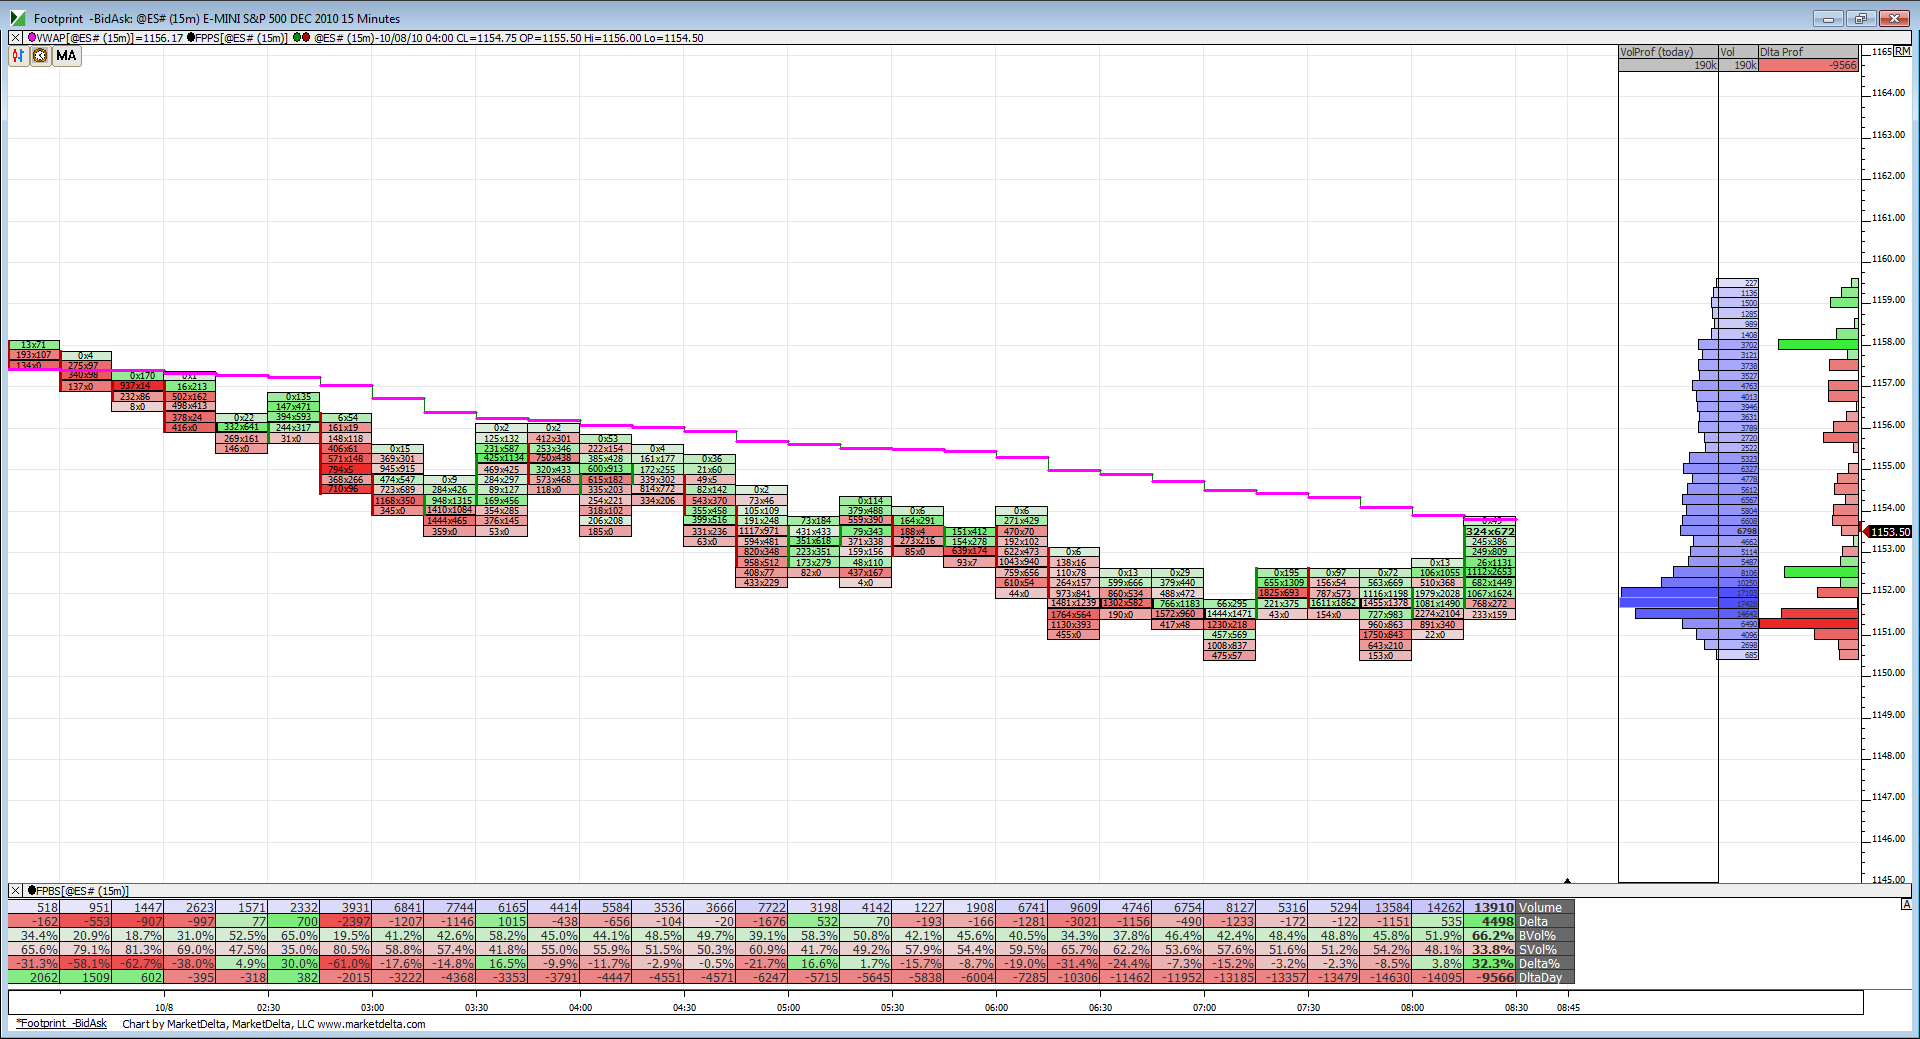
Will be very interesting to see how prices respond to this report at 8:30. Will we have range expansion or more of the same in recent weeks?
Click image for original size
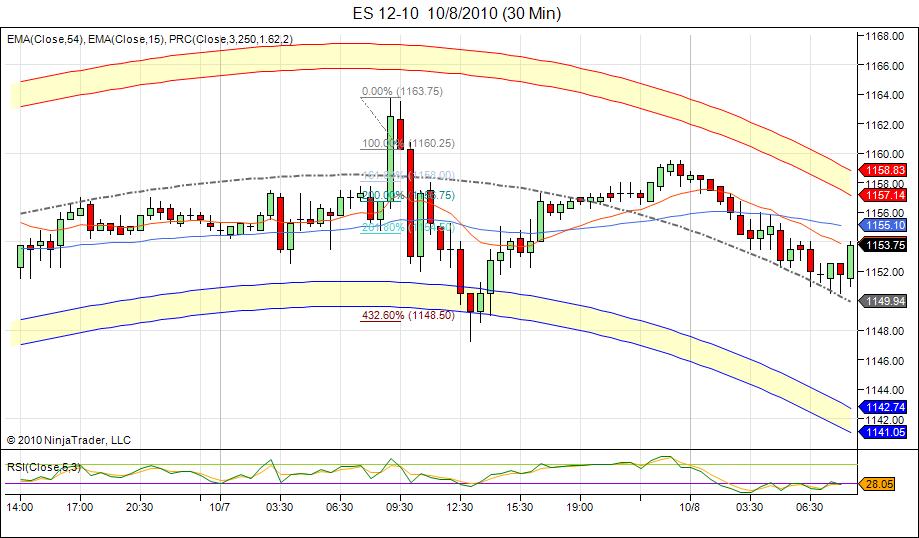
The only thing real clear on the fib side is this 30 min projection.
Click image for original size
That's a mightly long tail to 45.5 on the ES candle on the unemployment #s reaction. They seem to like to fill those.
That was quite a tail for sure.
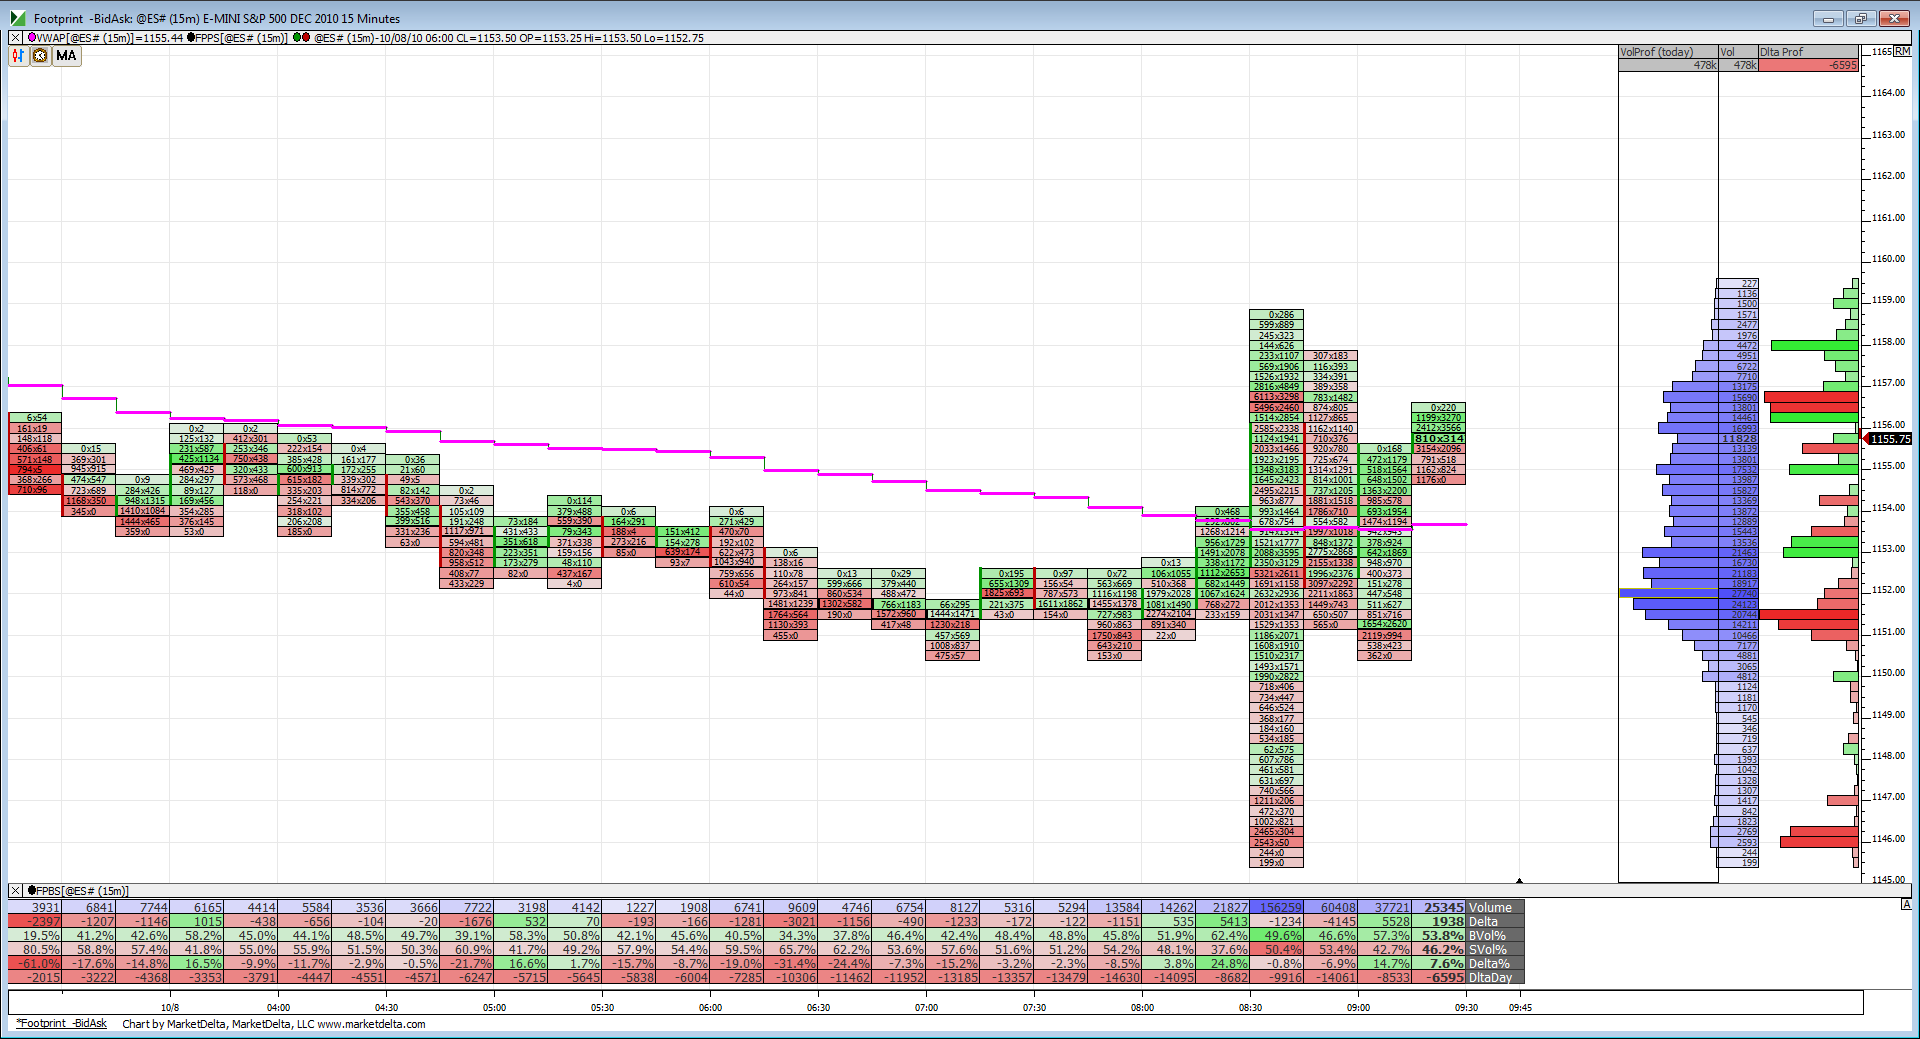
Something I see is volume building above 1151. The tail shows little volume in it.
Something I see is volume building above 1151. The tail shows little volume in it.
Click image for original size
employment report Friday is a day I usually don't trade. (And I don't plan on doing it today, either.
Yes, there is a large selling tail, but I do not know of a time-table as to when (if) it's lows will be tested.
After the flash crash, I looked back over charts for spike buying tails and spike selling tails. There were plenty of spike selling tails that simply never got revisited. (I looked at years of data) daily bars.
On an RTH basis. This is an inside day (selling tail was pre-market).
right now, could interpret the chart pattern on the 5 min 24hr prices as an Adam & Eve.
Adam first being the spike up (8:45am) and Eve rounded belly the PA RTH Open and 10:15am.
disregarding the selling tail, there are 3 distinct and "to the tic" low prints of 1150.50, and that is a price area to watch PA for signs of reversal or failure and fall.
Yea that 1150.50 is an important level to watch. Interesting thing about it is it shows up on multiple time frame charts, 5-min, 13-min, 15-min, 30 min. Quite interesting.
Originally posted by PAUL9
employment report Friday is a day I usually don't trade. (And I don't plan on doing it today, either.
Yes, there is a large selling tail, but I do not know of a time-table as to when (if) it's lows will be tested.
After the flash crash, I looked back over charts for spike buying tails and spike selling tails. There were plenty of spike selling tails that simply never got revisited. (I looked at years of data) daily bars.
On an RTH basis. This is an inside day (selling tail was pre-market).
right now, could interpret the chart pattern on the 5 min 24hr prices as an Adam & Eve.
Adam first being the spike up (8:45am) and Eve rounded belly the PA RTH Open and 10:15am.
disregarding the selling tail, there are 3 distinct and "to the tic" low prints of 1150.50, and that is a price area to watch PA for signs of reversal or failure and fall.
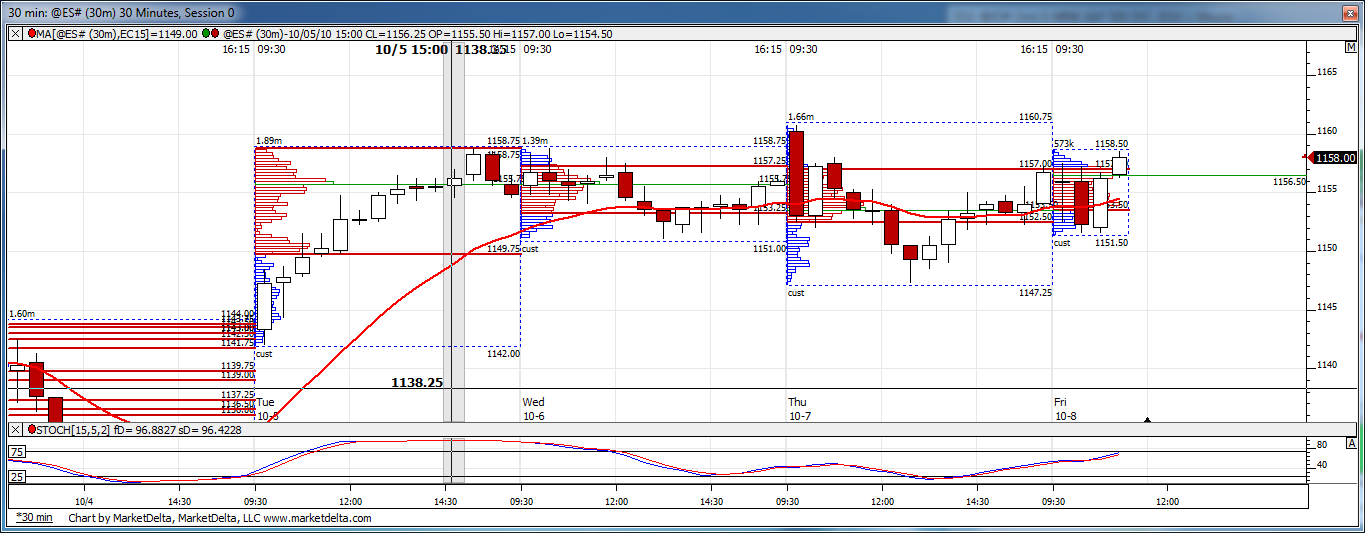
Take a look at these volume profiles since the big break up Tuesday. That is some serious consolidation within the chop. VAH and VAL almost all the same levels....
Click image for original size
Paul... got the official RTH fill of 61 on your Monday RTH extension trade... interesting trade with nice target... thanks for pointing it out...
Anybody paying attention to the agriculture futures? What the flop is going on today?
Originally posted by chrisp
Paul... got the official RTH fill of 61 on your Monday RTH extension trade... interesting trade with nice target... thanks for pointing it out...
I spent hours looking over charts to come up with that one.
I think today is going to be the last employment report Friday that I refuse to trade the RTH (or after the report).
I usually employ a 3 tic target range, so yesterday's H print would have satisfied my expectation for a move to the full extension at print 61.00, but I can tell you, when I was looking at the historic charts to unearth this jazz, I was putting the pointer on the price and making sure that full extension printed. I don't have stats, but I can tell you It's got to be north of 8 in 10.
Here's a ture story that happened today,
I usually don't trade employment report friday after the announcement,
but that virgin 1161.00 full extension looming overhead haunted me and after my prior post I decided to forget about not trading on Employment report Friday. As I stated, I am a, "3 tics is close enough" person...
get a load of this, I put in a buy limit 3 tics above that 50.50 I had mentioned... Low print was 51.50. I did not get filled. LOL
I blew it, what can I tell ya.
DJ-30 was so close to 11,000 magnet, it just had to print, and drag the S&P along with it.
You didn't blow it my friend. You placed a reasonable order and didn't get filled. Happens all the time so don't beat yourself up over it.
Originally posted by PAUL9
Originally posted by chrisp
Paul... got the official RTH fill of 61 on your Monday RTH extension trade... interesting trade with nice target... thanks for pointing it out...
I spent hours looking over charts to come up with that one.
I think today is going to be the last employment report Friday that I refuse to trade the RTH (or after the report).
I usually employ a 3 tic target range, so yesterday's H print would have satisfied my expectation for a move to the full extension at print 61.00, but I can tell you, when I was looking at the historic charts to unearth this jazz, I was putting the pointer on the price and making sure that full extension printed. I don't have stats, but I can tell you It's got to be north of 8 in 10.
Here's a ture story that happened today,
I usually don't trade employment report friday after the announcement,
but that virgin 1161.00 full extension looming overhead haunted me and after my prior post I decided to forget about not trading on Employment report Friday. As I stated, I am a, "3 tics is close enough" person...
get a load of this, I put in a buy limit 3 tics above that 50.50 I had mentioned... Low print was 51.50. I did not get filled. LOL
I blew it, what can I tell ya.
DJ-30 was so close to 11,000 magnet, it just had to print, and drag the S&P along with it.
Outstanding calls yesterday morning by Paul and Bruce. Nice trade guys!
Today and Monday are very important for the indexes, and appears that the grains are part of it too.
Are they all topping here or are they jumping the resistance! Some acceleration is most likely to occur. So be ready........tic, tic, tic.......
Today and Monday are very important for the indexes, and appears that the grains are part of it too.
Are they all topping here or are they jumping the resistance! Some acceleration is most likely to occur. So be ready........tic, tic, tic.......
Emini Day Trading /
Daily Notes /
Forecast /
Economic Events /
Search /
Terms and Conditions /
Disclaimer /
Books /
Online Books /
Site Map /
Contact /
Privacy Policy /
Links /
About /
Day Trading Forum /
Investment Calculators /
Pivot Point Calculator /
Market Profile Generator /
Fibonacci Calculator /
Mailing List /
Advertise Here /
Articles /
Financial Terms /
Brokers /
Software /
Holidays /
Stock Split Calendar /
Mortgage Calculator /
Donate
Copyright © 2004-2023, MyPivots. All rights reserved.
Copyright © 2004-2023, MyPivots. All rights reserved.