ES Short Term Trading 10-15-10
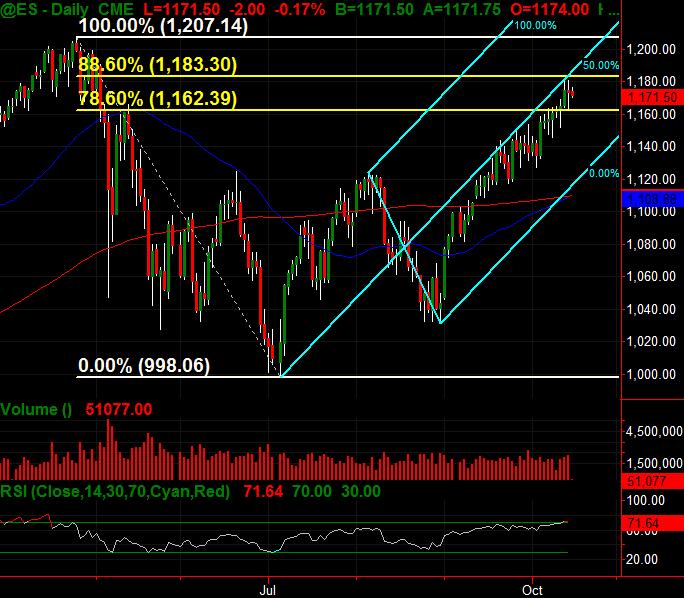
Here's what I've got with a Daily and 30 minute ES chart. The Daily is all-hours-trading with the yellow lines denoting the 786 and 886 fib retracements ... also in cyan is an Andrews Pitchfork that I've had drawn in for a week or two where price has been riding up the midline.
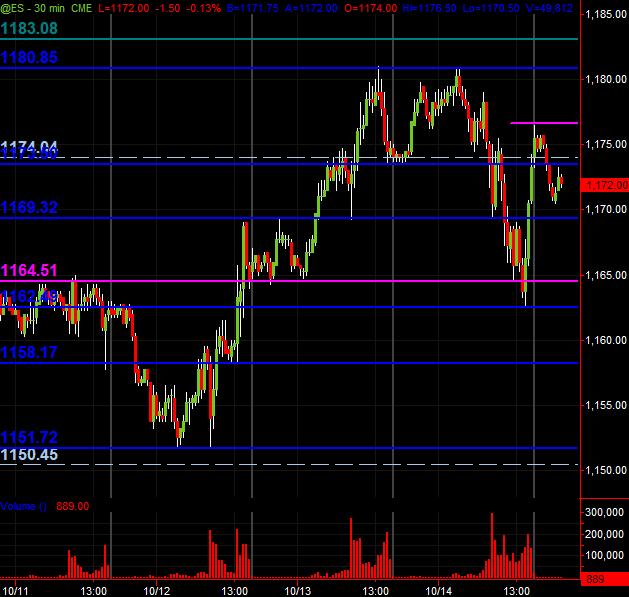
The 30 minute has the horizontal lines in Blue that denote potentially significant Price Action Support/Resistance areas. The Magenta lines are less significant. The horizontal cyan dashed lines are the Wkly Pivots.
This simply provides a map of the market for me. Hope, as always, that it's helpful to others.
Click image for original size
Click image for original size
I'm using 76.50 as the initial magnet price as that is where the ledge ( double top) was in O/N session...so that is first target from the 79 area......there is also a gap in the data from O/N volume spikes but not as reliable ..down near 1175...RATS...will only add if I see 81.50 in day session before target
Only other notable spot is that 69 number as that was a Low volume area from YD session and just under O/N low....
taking the short again at 79.25..reports in 20 minutes....be prepared .....we know where zone is...81 - 83....if they want to run us out
best fill is 76.25..have two left for a gap fill in case report is kind to me....otherwise 78 takes em out
Kool's Tools projection from 80-74 move = 64.25
KT projection from the 63-65.75 move = 70.25, unless 63 is taken out, fwiw
trips at 67.75 so bias is short off 71 area
71 is 50% back on down move...! Only Fib I like...if it actually is a fib!!
trips gonna run soon....gotta fill in the low volume of 69 some more first
stck inside 60 minute so they will play with 69 area...so sell above there
Emini Day Trading /
Daily Notes /
Forecast /
Economic Events /
Search /
Terms and Conditions /
Disclaimer /
Books /
Online Books /
Site Map /
Contact /
Privacy Policy /
Links /
About /
Day Trading Forum /
Investment Calculators /
Pivot Point Calculator /
Market Profile Generator /
Fibonacci Calculator /
Mailing List /
Advertise Here /
Articles /
Financial Terms /
Brokers /
Software /
Holidays /
Stock Split Calendar /
Mortgage Calculator /
Donate
Copyright © 2004-2023, MyPivots. All rights reserved.
Copyright © 2004-2023, MyPivots. All rights reserved.