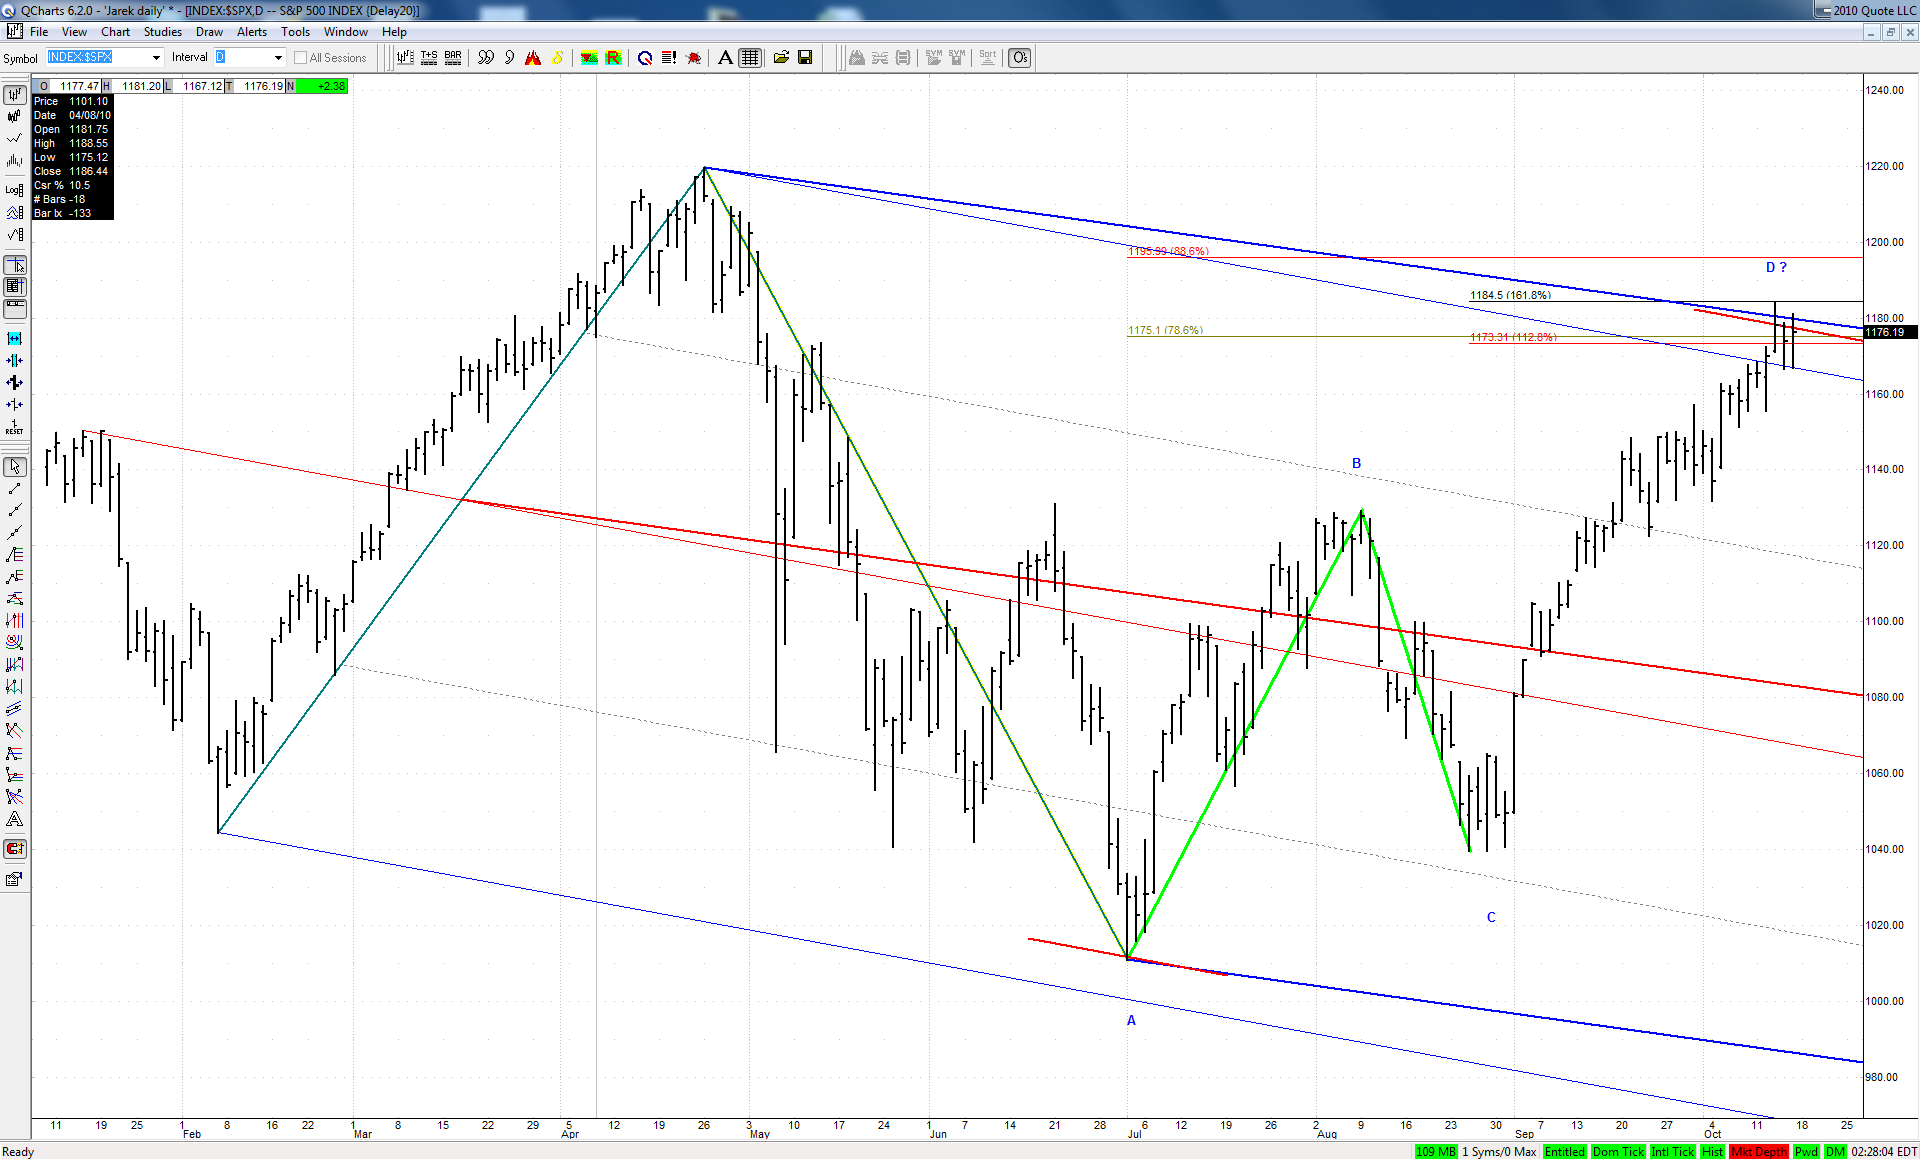
Not much to add to what was already told here about the importance of the current area. One more think I noticed is that the recent high in $SPX was exactly on the upper ML of an important Schiff set based on Feb-Apr and Apr-Jul swings:
Click image for original size
Friday's morning high could have been just a test of this line.
From how it all sets up we may assume that coming move in either direction should be strong and sustainable.
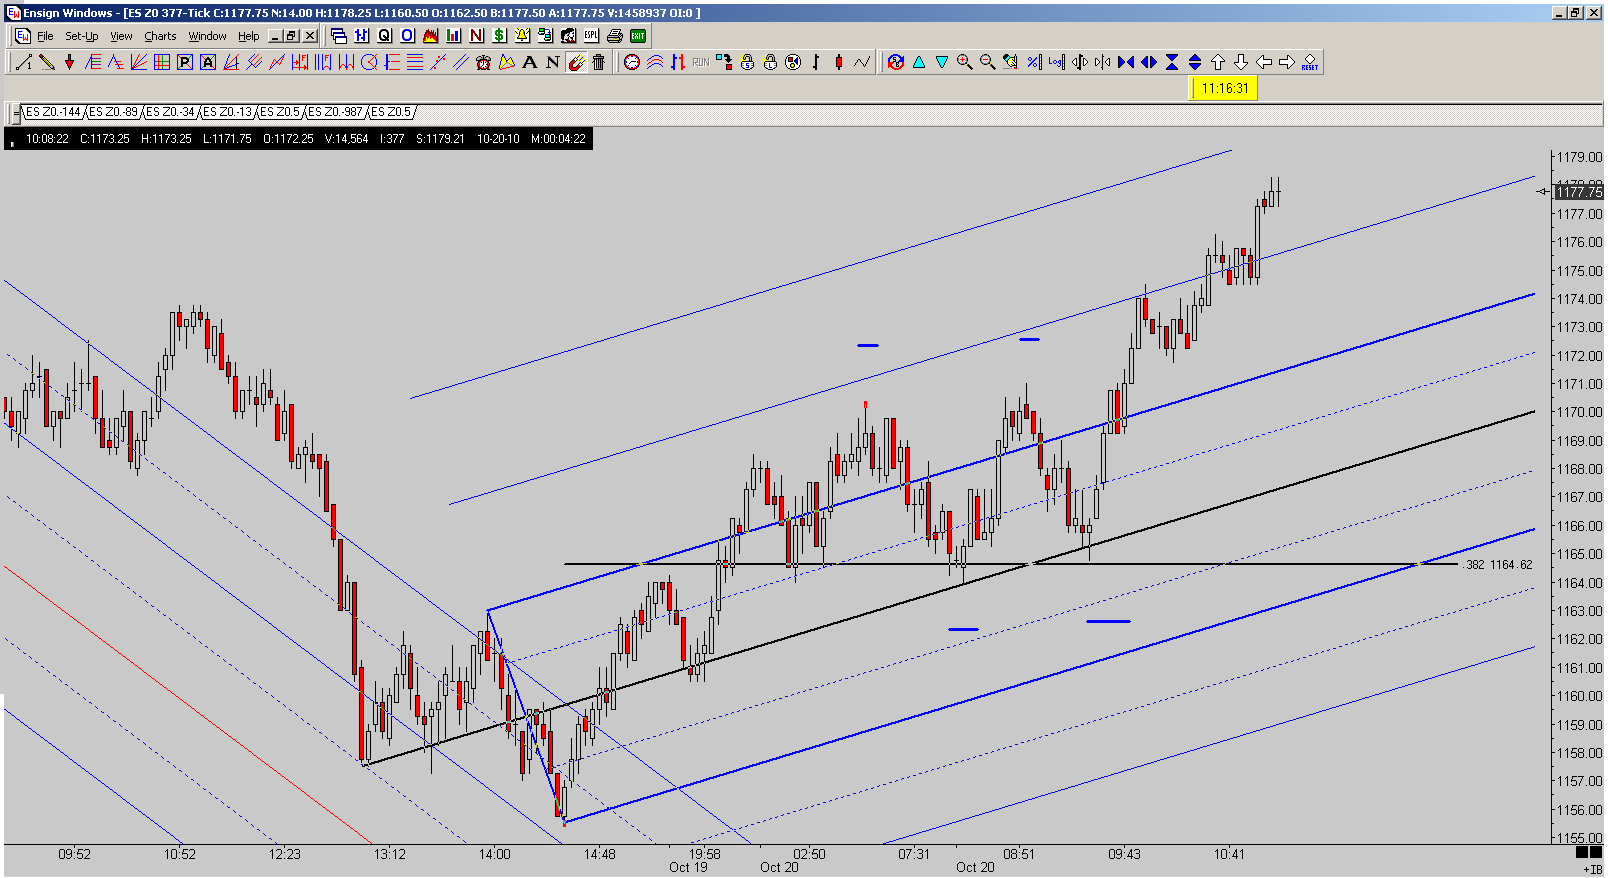
Kane TD ABCD completing at 0.382 Fibo. Awesome action.
Al Kamego
Click image for original size
JI
jimkane
Rep: 3,058
Posts: 33,089
2
(Edited )
Just a mention here. Very unlikely to happen. I have a pattern here that if the DX rose (a monster if) to around 79.56, that might be a bigger bearish setup to really crush it. I think they will crush it from here, because I can't see another dip back to a lower area on the ES from here, and that would be how it would play out. Election day is coming, and this thing is right on schedule to complete my Sept/Oct non-stop run into it. But, it is a curious scenario so I thought I'd mention that it could shape up if the DX did start to rise here, so, if it does, I'll be working that premise.
The 79.56 area will change if this drops any lower here and then starts to rise. That number is based on the low being in, here, already.
JI
jimkane
Rep: 3,058
Posts: 33,089
1
Careful in here, in case they check it back more than 1-2 ticks.
JI
jimkane
Rep: 3,058
Posts: 33,089
1
This 76.75 area here is a major one on the 1-min, so if they plan to stay status quo there, they'll gun it from here.
JI
jimkane
Rep: 3,058
Posts: 33,089
1
Very interesting how it is oscillating between the 3D and the little ABCD area, postponing the decision.
JI
jimkane
Rep: 3,058
Posts: 33,089
1
(Edited )
I would think the upside resolution is highly favored, though, so I'll be watching for the move to 86-87 to start from this coil. You never, know, though, they may play some games with it.
JI
jimkane
Rep: 3,058
Posts: 33,089
1
I'm looking back at my work, and I'm seeing more at 87 and even 88, so I wonder if this isn't best looked at as 86-88. Way back I said 1190 was a key area, from calculations separate from the ones I'm doing for today's area. So, somewhere from say 86-90 is a key area where it may pause, and that the bulls likely want to see ASAP. It's tough to figure where things may be going. The methodology is all about finding areas to trade against, not predicting where things will go or what they may do.
I'm more or less pointing out areas that may weigh into my management. And, in this crazy environment of manipulation bull action, I feel I can get a decent handle on where the bulls want to push it at any given time, to accomplish their nefarious goals and do as much damage as possible. So, those areas can sometimes act as magnets, it seems. Hence, I talk about them in the light of management. Keep that in mind.
JI
jimkane
Rep: 3,058
Posts: 33,089
0
Top of the hour the 'Tan book' comes out. That should get the market up to that 80's level, eh? Any excuse...
JA
jarek
Rep: 94
Posts: 3,474
1
(Edited )
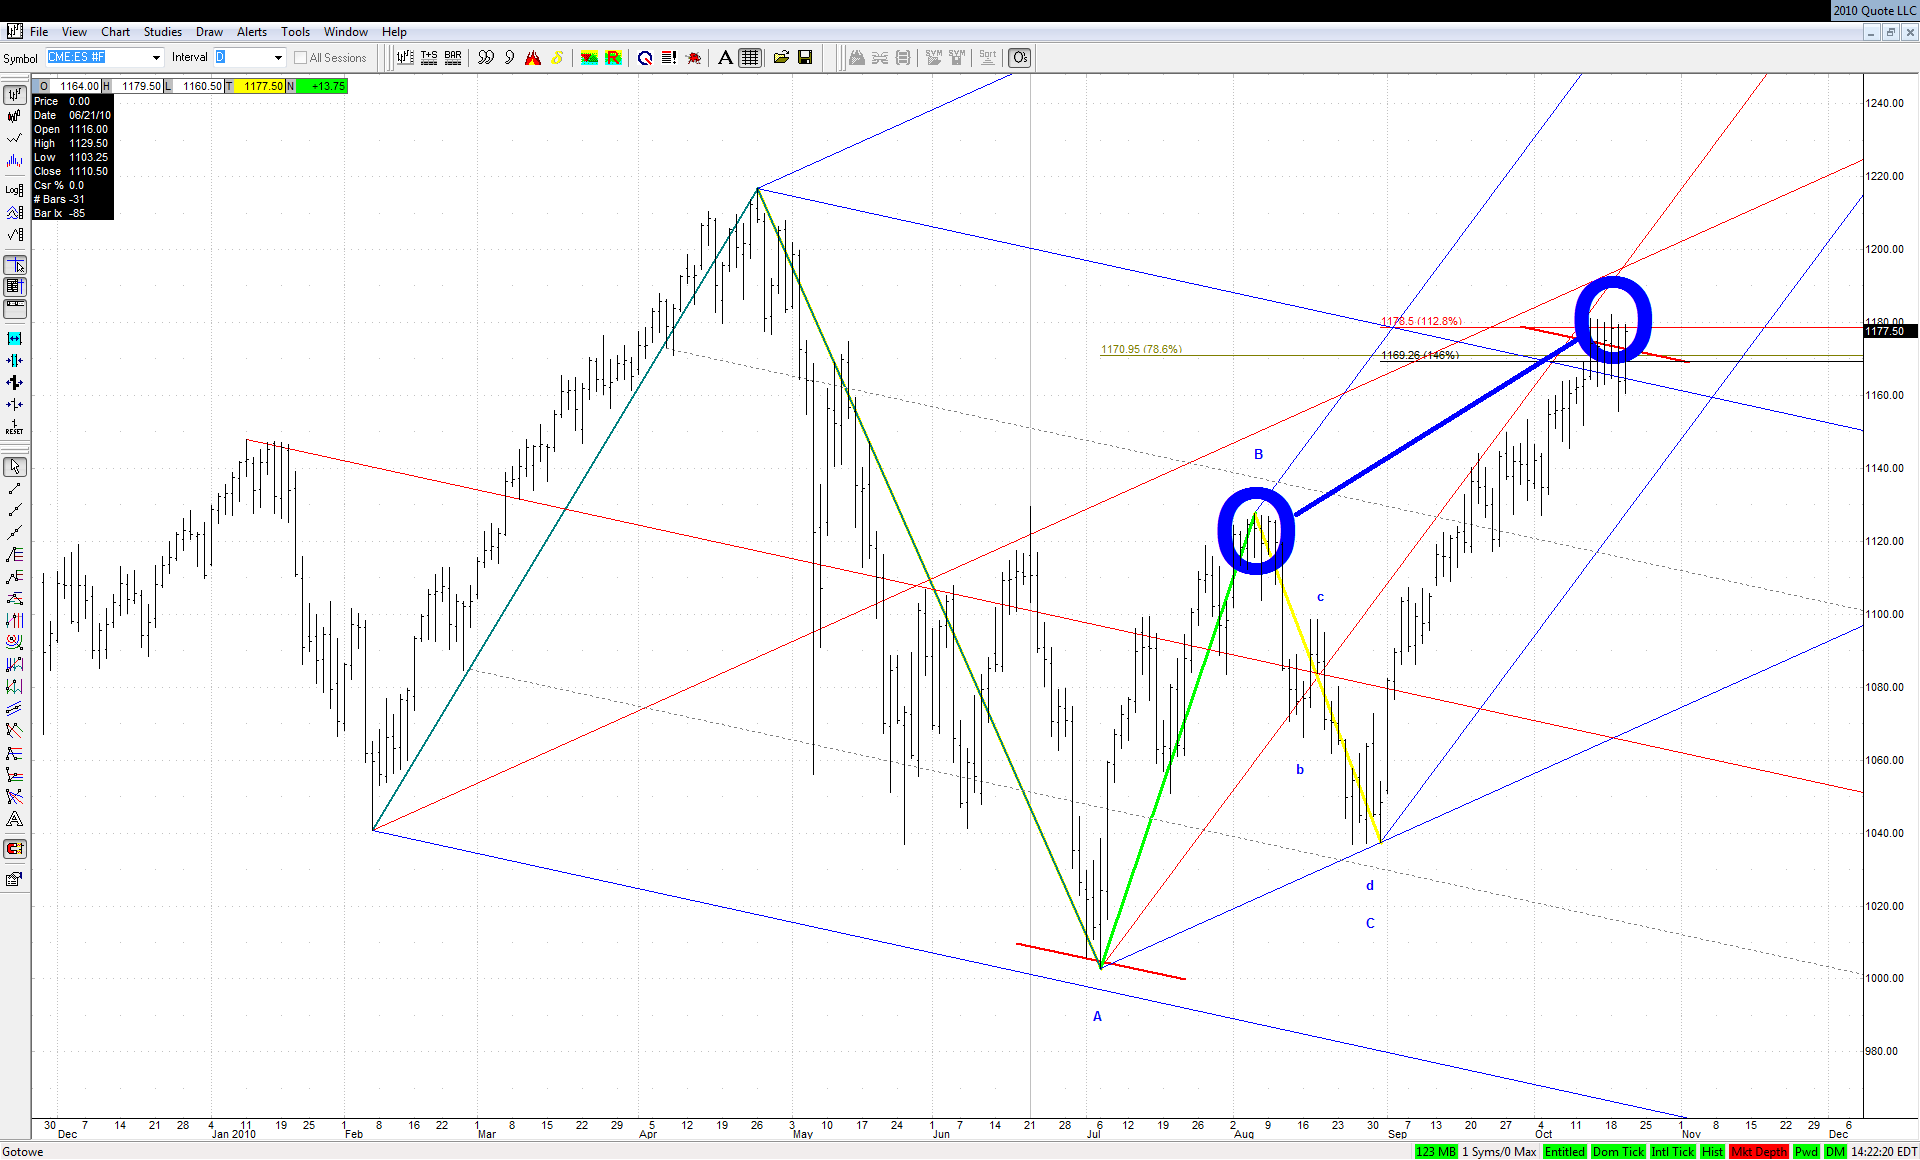
Here is something interesting I noted: while forming the early August top there were 7 days in a row with similar highs (5 points difference) and on day 5 there was an unsuccessfull attempt for a breakdown:
Click image for original size
Today we have 6th day in a row with very similar highs (only 3 points difference) and yesterday was a day number 5 with a try for a breakdown ...
JI
jimkane
Rep: 3,058
Posts: 33,089
1
(Edited )
Great observation, jarek. I love stuff like that. This kind of action, as one can see by looking back over the last 6 months or a year, is increasing common in reversal areas. Sometimes it gives way and the trend continues (up or down), but mostly it reverses. Somehow I just can't comprehend this reversing, I can only see new all-time highs and S&P 10,000 (after the dollar crisis and collapse or devaluation), but, if it were to, the formation is still there for it to do it.
As a side note, on a percentage basis, the number one performing stock market on earth at the time was Zimbabwe's market when they were in hyperinflation. The market was way, way, way up, but as I said, higher price, lower value. You couldn't buy as much with the price up that much, per share, as you could when it was way lower. The S&P may be at 10,000, but per share of the index, you'll get less for them (in goods and services) than right now. That's my viewpoint, anyway.
Okay, what a place to close it, once again right on my area. How often do they do that? I still think the odds favor the bulls, but it sure would be nice for these technicals to play out and the big areas to send this way down. I can dream, can't I? I may take tommorrow off from the forum, I need a break, since as you can see, I tend to post a lot. If so, I'll be back as soon as I feel 'rested'. I may just watch you guys, but when I do one of two things usually happens: no one posts and there is nothing to watch, or, I just get sucked in and post anyway.
I may make a few comments today, for example, if/when this blows out my area to the upside in after-cash or in GLOBEX...