ES S/R Zones Map for 11-11-10
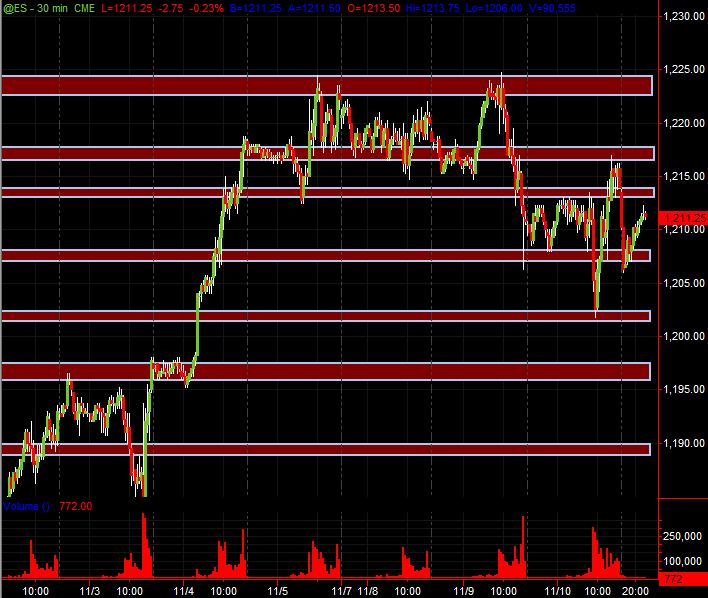
This is what I've got for S/R Zones for Thursday's session. It's derived from PASR/Fib/Daily-Wkly-Pvts and a couple other thangs ... no magic here as its core is the PASR ... all coming from viewing multiple time frames. Hope this is as useful as my prior "maps" that typically had a bunch of lines with all kinds of different and pretty colors ... some solid and some dashed etc.
This is what I'm looking at ... displayed on a 30-minute chart for potential Support/Resistance Zones for Thursday's trading session. Any and all feedback and additional analysis is highly encouraged!
This is what I'm looking at ... displayed on a 30-minute chart for potential Support/Resistance Zones for Thursday's trading session. Any and all feedback and additional analysis is highly encouraged!
Click image for original size
MM,thx for your reply.I thought the S/R zone you draw are very important.So,we can use them to help our trade several days.And you will update S/R zone when ES breakout S/R range.I wonder if I understand this right?BTW,my english is very pool.If my words is hard to read,i am very sorry...
Originally posted by i1hunter
Yesterday's intraday high was 1216.75. Low was 1201.75 = 15.00 rge. 15/2 = 7.50.
1201.75, yesterday's low + 7.50 = 1209.25. So, 1209.25 is 50% of yesterday's rge.
Today's first hourly bar high was 1209.50.
The market open at 1205.75 or 1/4 above yesterday's low. Will you call this symmetry?
Currently ES is trading in the lower 1/2 of yesterday's rge, at 1204.25 @ 11:11 0n 11/11
. ....I have a fibs. back again at 1195.00 or so. - Will see. In due time will show me the way.........
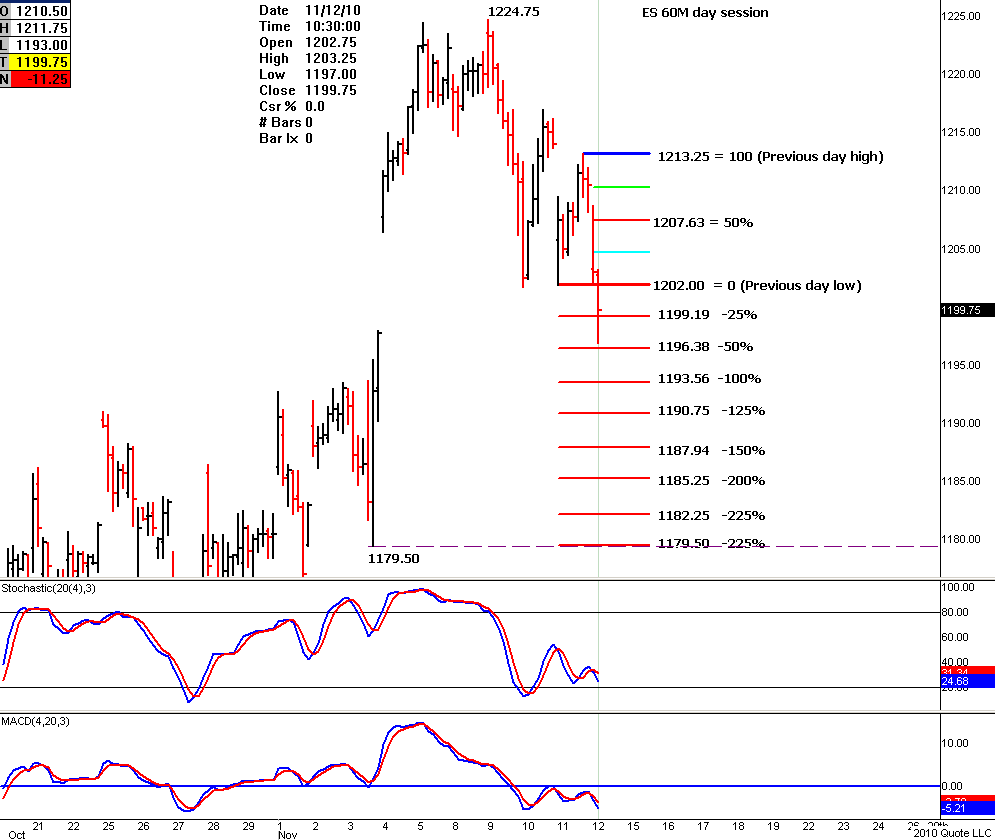
Here is today's 60m chart showing yesterday's RGE and today's subdivisions. What's interesting is that the night session already hit the 1193 area.
I hope that from this chart there's congruency somewhere with your numbers and projections. The more you have a particular number showing up from different outlooks, the more the adds to become a real target.
Click image for original size
Emini Day Trading /
Daily Notes /
Forecast /
Economic Events /
Search /
Terms and Conditions /
Disclaimer /
Books /
Online Books /
Site Map /
Contact /
Privacy Policy /
Links /
About /
Day Trading Forum /
Investment Calculators /
Pivot Point Calculator /
Market Profile Generator /
Fibonacci Calculator /
Mailing List /
Advertise Here /
Articles /
Financial Terms /
Brokers /
Software /
Holidays /
Stock Split Calendar /
Mortgage Calculator /
Donate
Copyright © 2004-2023, MyPivots. All rights reserved.
Copyright © 2004-2023, MyPivots. All rights reserved.