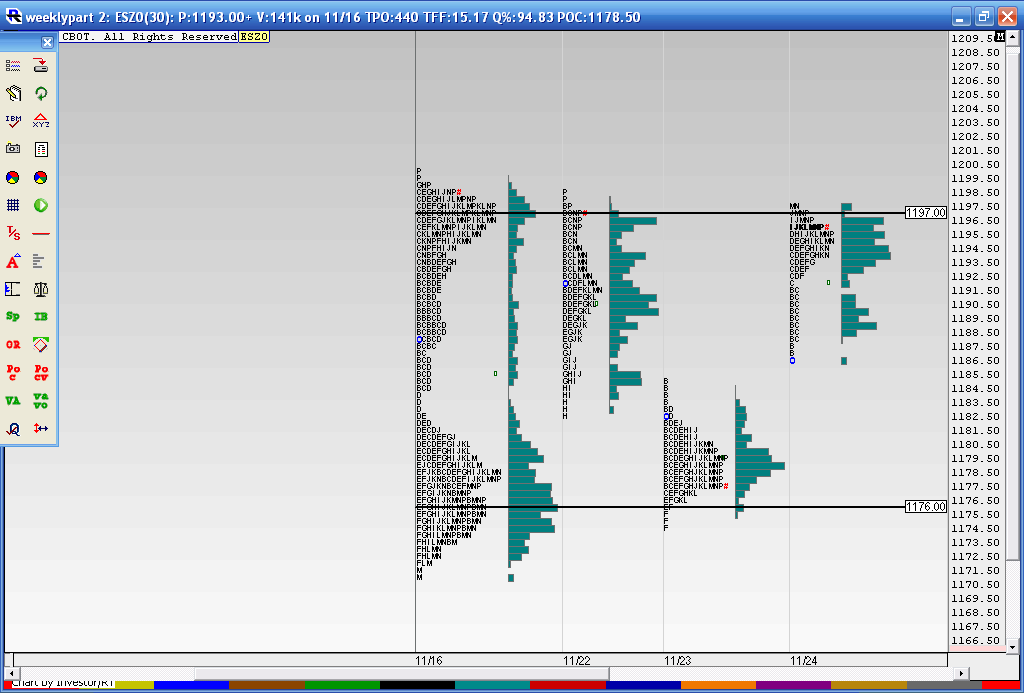
The C pattern
Your looking at last weeks trading profile and then the first three days of Thanksgiving week.You can see the high Volume up at 1197 and then down at the 1176 area....these are so far the key areas to monitor.....You can use your imagination and draw the letter "C" from the 1197 number down to the 1176 number...these lower volume areas tend to fill in over time like they did on Mon, Tues and Wednesday.
On Wednesday we had a 10 to 1 up volume day and 5 to 1 lead of advancers to decliners. Unfortunately it was lower volume , holiday trade. The point is that I'd be cautious of any higher trading over the holiday. We usually don't see very strong follow through in the RTH session following such a strong day. So if we happen to gap higher in the shortened session on Friday then fades SHOULD be a good wager.
On Wednesday we had a 10 to 1 up volume day and 5 to 1 lead of advancers to decliners. Unfortunately it was lower volume , holiday trade. The point is that I'd be cautious of any higher trading over the holiday. We usually don't see very strong follow through in the RTH session following such a strong day. So if we happen to gap higher in the shortened session on Friday then fades SHOULD be a good wager.
Click image for original size
If we can get to 1182, 1190 would be a good target
Good to see you posting again AK1. The O/N session took out your 90 area and those triples left over from Fridays low volume down move. WE are still in one big consolidation.
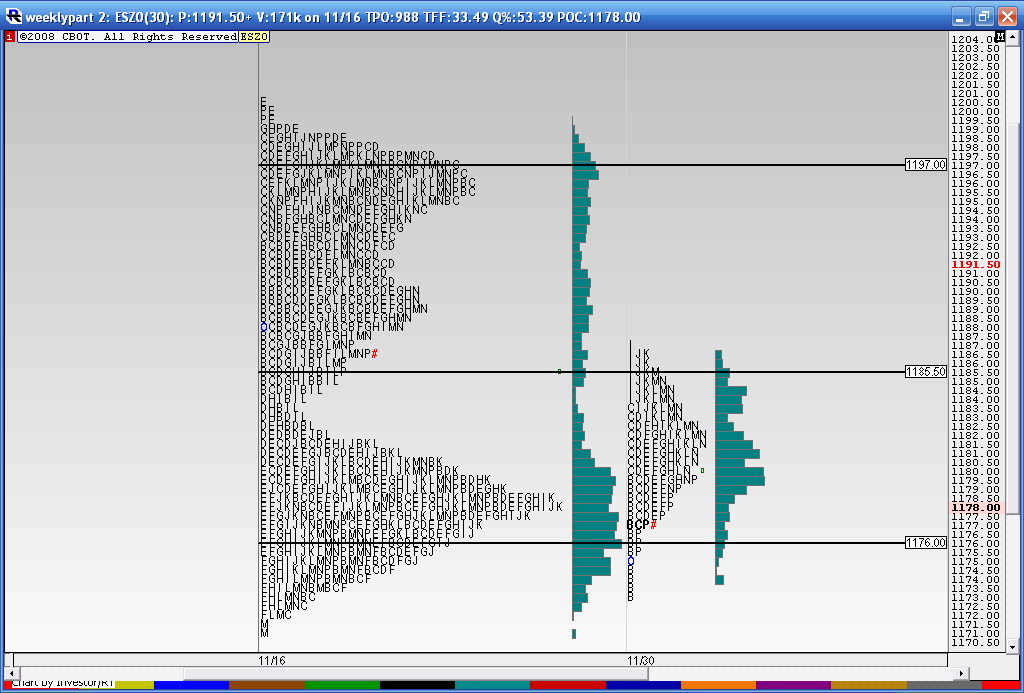
Here's an update to the pattern. I have added one more line which is the mid-range of this formation. I also have separated out today's trading as it shows the "D" pattern which is nothing more than a neutral or symmetric pattern of volume.
The mistake that I have made with my longer term analysis in the past is waiting for perfection. We read these books and web sites telling us how profiles become Mature and rounded out ...like an upper case letter "D" but they don't always end up so well formed and we miss opportunities.
We are currently building Volume at the lower end of this distribution. Many times when you see volume building above or below the midpoint of a distribution it can help point the direction. A good example of this would be from today's trading. We built volume in the upper half of the first hours range and broke out of that range from the top side. Price was getting accepted at higher prices within the first hours range and eventually lead to an upside breakout ( that failed) of the first hours high.
So if the concept proves true then a breakdown should happen to drive prices lower and build new value as volume is building lower. Prices are getting accepted at lower prices. When we rally up we revert back to the lower prices. On the flip side we also need to be asking ourselves if too much time is being spent at these lower prices only to reject the low prices and rally higher and fill in more of the "D" pattern.
The two main things we need to watch for are:
1)A gap lower in the RTH session beyond 1271 that keeps going.....a valid break out down or
2)A breakdown of price that reverts back into the range - this could lead to a retest of the opposite extreme or at least fill in the "D" pattern more.
Today's trading makes things interesting and it seems that the market is getting ready to decide a direction even if the longer term "D" pattern hasn't completed.
Click image for original size
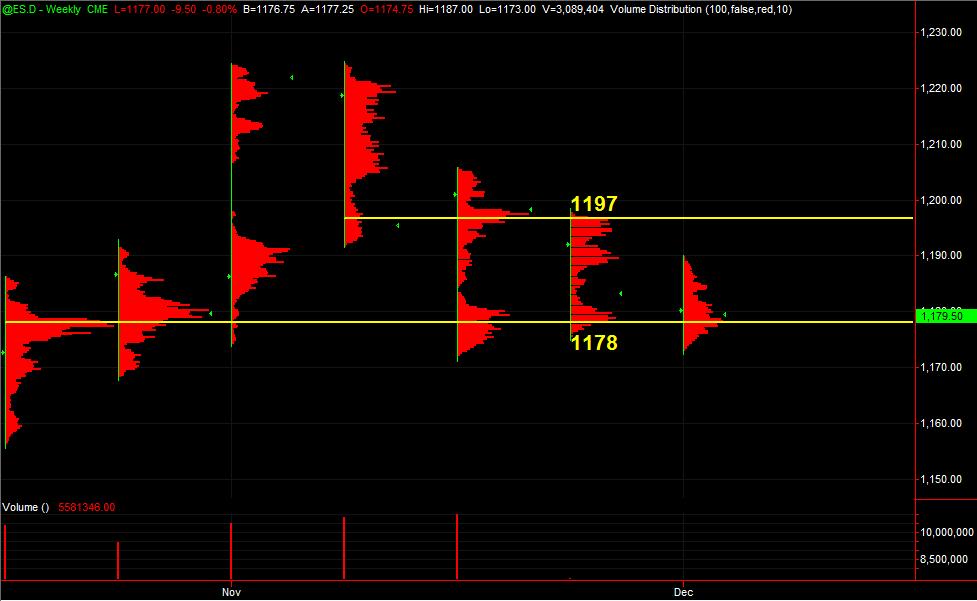
ES has traded up to that 1197 area here just a few minutes before the RTH open ... hell of an overnight global and U.S. trend so far.
Here's what I had on TradeStation using Weekly Volume at Price on RTH's.
Here's what I had on TradeStation using Weekly Volume at Price on RTH's.
Click image for original size
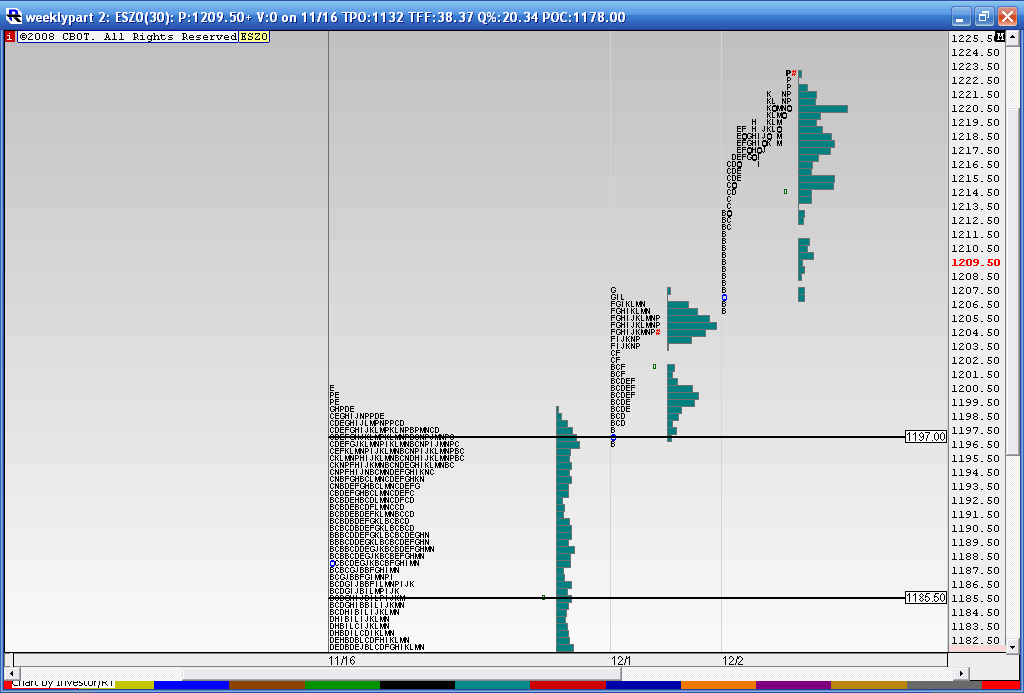
here is the breakout up from the "C" pattern...I was expecting this to happen on the downside....so I was completely fooled by these last two days of trading....almost seems depressing to me.....lessons from the market are tough on the ego sometimes.....I'm not sure if posting ones thoughts and trades makes it worse ....but so far the market has spoken and the current direction is up..
With that said I STILL have an uneasy feeling about this rally...something seems a bit off....perhaps it's me who is off.
With that said I STILL have an uneasy feeling about this rally...something seems a bit off....perhaps it's me who is off.
Click image for original size
Emini Day Trading /
Daily Notes /
Forecast /
Economic Events /
Search /
Terms and Conditions /
Disclaimer /
Books /
Online Books /
Site Map /
Contact /
Privacy Policy /
Links /
About /
Day Trading Forum /
Investment Calculators /
Pivot Point Calculator /
Market Profile Generator /
Fibonacci Calculator /
Mailing List /
Advertise Here /
Articles /
Financial Terms /
Brokers /
Software /
Holidays /
Stock Split Calendar /
Mortgage Calculator /
Donate
Copyright © 2004-2023, MyPivots. All rights reserved.
Copyright © 2004-2023, MyPivots. All rights reserved.